ClearStepsCLEARSTEPS AI
Teacher Login →Student Login →

Statistics: Class 10 Maths Practice Questions

30 original exam-pattern questions with full answers, matched to the current CBSE Class 10 paper design, including case-based questions. Attempt each question before opening the answer — or start a free 14-day trial ↓ for the full bank.

Q1Case-based4 marks

A district hospital in Pune conducted a health camp to study the age distribution of patients visiting the outpatient department over a period of one month. Dr. Meena Kulkarni, the chief medical officer, recorded the ages of 80 patients and organised the data into the following frequency distribution table:

| Age (in years) | Number of Patients |
|---|---|
| 10 – 20 | 6 |
| 20 – 30 | 11 |
| 30 – 40 | 21 |
| 40 – 50 | 23 |
| 50 – 60 | 14 |
| 60 – 70 | 5 |

This data was to be analysed to understand the age profile of patients and assist in better allocation of medical resources across different age groups.

A district hospital in Pune conducted a health camp to study the age distribution of patients visiting the outpatient department over a period of one month. Dr. Meena Kulkarni, the chief medical officer, recorded the ages of 80 patients and organised the data into the following frequency distribution table:

| Age (in years) | Number of Patients |
|---|---|
| 10 – 20 | 6 |
| 20 – 30 | 11 |
| 30 – 40 | 21 |
| 40 – 50 | 23 |
| 50 – 60 | 14 |
| 60 – 70 | 5 |

This data was to be analysed to understand the age profile of patients and assist in better allocation of medical resources across different age groups.

Show answer
(i)

The modal class is the class with the highest frequency.

From the table, the frequencies are 6, 11, 21, 23, 14, 5. The highest frequency is 23, corresponding to the class 40–50.

∴ Modal class = 40–50

---

(ii)

Total number of patients, n = 80 ⟹ n/2 = 40.

Cumulative frequencies:

| Age (in years) | Frequency | Cumulative Frequency |
|---|---|---|
| 10 – 20 | 6 | 6 |
| 20 – 30 | 11 | 17 |
| 30 – 40 | 21 | 38 |
| 40 – 50 | 23 | 61 |
| 50 – 60 | 14 | 75 |
| 60 – 70 | 5 | 80 |

The cumulative frequency first exceeds n/2 = 40 in the class 40–50.

∴ Median class = 40–50

---

(iii)

Using the Direct Method, Mean = Σfᵢxᵢ / Σfᵢ.

| Age (in years) | Midpoint xᵢ | Frequency fᵢ | fᵢxᵢ |
|---|---|---|---|
| 10 – 20 | 15 | 6 | 90 |
| 20 – 30 | 25 | 11 | 275 |
| 30 – 40 | 35 | 21 | 735 |
| 40 – 50 | 45 | 23 | 1035 |
| 50 – 60 | 55 | 14 | 770 |
| 60 – 70 | 65 | 5 | 325 |
| Total | | Σfᵢ = 80 | Σfᵢxᵢ = 3230 |

Mean = Σfᵢxᵢ / Σfᵢ = 3230 / 80

∴ Mean age = 40.375 years
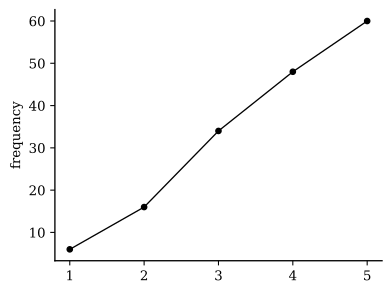
Q2Case-based4 marks

A community health centre in Bhopal organised a free medical screening camp for residents of a nearby locality. Dr. Meena Sharma, the camp coordinator, recorded the ages of 80 patients who attended the camp and grouped the data into class intervals as shown in the table below.

| Age (in years) | 10–20 | 20–30 | 30–40 | 40–50 | 50–60 | 60–70 |
|----------------|-------|-------|-------|-------|-------|-------|
| Number of patients | 6 | 11 | 21 | 23 | 14 | 5 |

A community health centre in Bhopal organised a free medical screening camp for residents of a nearby locality. Dr. Meena Sharma, the camp coordinator, recorded the ages of 80 patients who attended the camp and grouped the data into class intervals as shown in the table below.

| Age (in years) | 10–20 | 20–30 | 30–40 | 40–50 | 50–60 | 60–70 |
|----------------|-------|-------|-------|-------|-------|-------|
| Number of patients | 6 | 11 | 21 | 23 | 14 | 5 |

Show answer
(i) Modal Class

The modal class is the class interval with the highest frequency.

From the table, the frequencies are: 6, 11, 21, 23, 14, 5.

The highest frequency is 23, corresponding to the class interval 40–50.

∴ The modal class is 40–50.

---

(ii) Median Class

n = Σfᵢ = 80 ⟹ n/2 = 40

Cumulative frequency table:

| Age (in years) | Frequency (fᵢ) | Cumulative Frequency (cf) |
|----------------|----------------|---------------------------|
| 10–20 | 6 | 6 |
| 20–30 | 11 | 17 |
| 30–40 | 21 | 38 |
| 40–50 | 23 | 61 |
| 50–60 | 14 | 75 |
| 60–70 | 5 | 80 |

The cumulative frequency first exceeds n/2 = 40 in the class 40–50 (cf rises from 38 to 61).

∴ The median class is 40–50.

---

(iii) Mean Age

Using the Direct Method: Mean = Σfᵢxᵢ / Σfᵢ

| Age (in years) | fᵢ | xᵢ (mid-value) | fᵢxᵢ |
|----------------|-----|----------------|-------|
| 10–20 | 6 | 15 | 90 |
| 20–30 | 11 | 25 | 275 |
| 30–40 | 21 | 35 | 735 |
| 40–50 | 23 | 45 | 1035 |
| 50–60 | 14 | 55 | 770 |
| 60–70 | 5 | 65 | 325 |
| Total | 80 | | 3230 |

Mean = Σfᵢxᵢ / Σfᵢ = 3230 / 80

∴ Mean age = 40.375 years
Q3Case-based4 marks

A municipal library in Pune recorded the number of books borrowed by its members during a month. The data for 60 members is given below:

| Number of books borrowed | 0–5 | 5–10 | 10–15 | 15–20 | 20–25 |
|---|---|---|---|---|---|
| Number of members | 6 | 10 | 18 | 14 | 12 |

The librarian wants to analyse borrowing habits by constructing ogives and estimating the median number of books borrowed.

A municipal library in Pune recorded the number of books borrowed by its members during a month. The data for 60 members is given below:

| Number of books borrowed | 0–5 | 5–10 | 10–15 | 15–20 | 20–25 |
|---|---|---|---|---|---|
| Number of members | 6 | 10 | 18 | 14 | 12 |

The librarian wants to analyse borrowing habits by constructing ogives and estimating the median number of books borrowed.

Diagram for question 3: Statistics
Show answer
(i)

Cumulative frequency table ('less than' type):

| Upper Boundary | Cumulative Frequency |
|---|---|
| Less than 5 | 6 |
| Less than 10 | 6 + 10 = 16 |
| Less than 15 | 16 + 18 = 34 |

∴ The cumulative frequency corresponding to the class 10–15 (i.e., less than 15) is 34.

---

(ii)

'More than 10' cumulative frequency = Total members − (members in 0–5 and 5–10)

⟹ = 60 − 6 − 10 = 44

∴ The coordinates of the point on the 'more than' ogive for class boundary 10 are (10, 44).

---

(iii)

'Less than' cumulative frequency table:

| Upper Boundary | Cumulative Frequency (cf) |
|---|---|
| Less than 5 | 6 |
| Less than 10 | 16 |
| Less than 15 | 34 |
| Less than 20 | 48 |
| Less than 25 | 60 |

n = Σf = 60 ∴ n/2 = 30

The cumulative frequency first exceeds 30 in the class 10–15.

∴ Median class = 10–15, where l = 10, cf = 16, f = 18, h = 5.

Applying the Median formula:

Median = l + [(n/2 − cf) / f] × h

⟹ Median = 10 + [(30 − 16) / 18] × 5

⟹ Median = 10 + [14/18] × 5

⟹ Median = 10 + 70/18

⟹ Median = 10 + 35/9

∴ Median = 125/9 ≈ 13.9 books
Q4Case-based4 marks

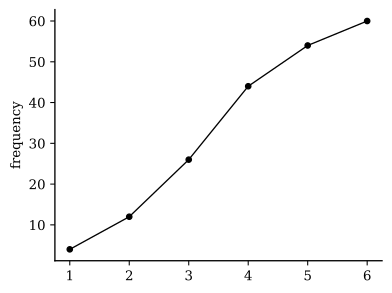
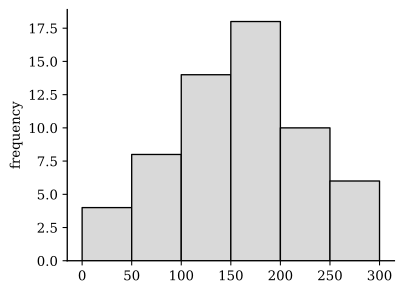
A municipal corporation recorded the daily water consumption (in litres) of 60 households in a newly developed colony. The data collected was grouped into class intervals as follows: 0–50: 4 households, 50–100: 8 households, 100–150: 14 households, 150–200: 18 households, 200–250: 10 households, 250–300: 6 households. The data is being analysed to understand consumption patterns and plan water supply accordingly.

A municipal corporation recorded the daily water consumption (in litres) of 60 households in a newly developed colony. The data collected was grouped into class intervals as follows: 0–50: 4 households, 50–100: 8 households, 100–150: 14 households, 150–200: 18 households, 200–250: 10 households, 250–300: 6 households. The data is being analysed to understand consumption patterns and plan water supply accordingly.

Diagram for question 4: Statistics
Show answer
(i)

Cumulative frequency up to the class 150–200:

cf = 4 + 8 + 14 + 18 = 44

∴ The cumulative frequency up to the class 150–200 is 44.

---

(ii)

Total number of households, n = Σfᵢ = 4 + 8 + 14 + 18 + 10 + 6 = 60

⟹ n/2 = 60/2 = 30

∴ The value of n/2 is 30.

---

(iii)

'Less than' Ogive — points to be plotted:

| Upper Class Boundary | Cumulative Frequency |
|---|---|
| 50 | 4 |
| 100 | 12 |
| 150 | 26 |
| 200 | 44 |
| 250 | 54 |
| 300 | 60 |

Plot the points (50, 4), (100, 12), (150, 26), (200, 44), (250, 54), (300, 60) on a graph with upper class boundaries on the x-axis and cumulative frequency on the y-axis. Join them with a smooth freehand curve to obtain the 'less than' ogive.

Reading the Median from the Ogive:

Draw a horizontal line from n/2 = 30 on the cumulative frequency axis to meet the ogive, then draw a vertical line from that point to the x-axis. The x-value obtained is the median.

Since cf = 26 at x = 150 and cf = 44 at x = 200, the point corresponding to cf = 30 lies in the interval 150–200, giving median ≈ 161.1 litres.

Verification using the Median Formula:

Median class = 150–200 (∵ cumulative frequency first exceeds n/2 = 30 in this class)

Median = l + [(n/2 − cf) / f] × h

where l = 150, cf = 26, f = 18, h = 50

⟹ Median = 150 + [(30 − 26) / 18] × 50

⟹ Median = 150 + [4/18] × 50

⟹ Median = 150 + 200/18

⟹ Median = 150 + 11.1̄

Median daily water consumption ≈ 161.1 litres
Q5Case-based4 marks

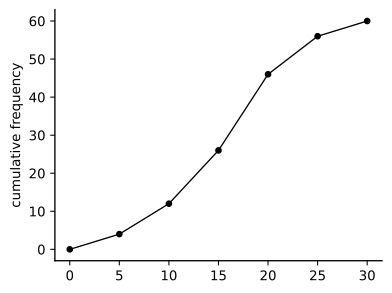
A school in Jaipur conducted a survey to study the screen time (in hours per week) of 60 students from Class 10. The data collected was organised into the following frequency distribution table: Screen time (hrs/week): 0–5, 5–10, 10–15, 15–20, 20–25, 25–30; Number of students: 4, 8, 14, 20, 10, 4. The school counsellor decided to draw ogives to analyse the data and find the median screen time of the students.

A school in Jaipur conducted a survey to study the screen time (in hours per week) of 60 students from Class 10. The data collected was organised into the following frequency distribution table: Screen time (hrs/week): 0–5, 5–10, 10–15, 15–20, 20–25, 25–30; Number of students: 4, 8, 14, 20, 10, 4. The school counsellor decided to draw ogives to analyse the data and find the median screen time of the students.

Diagram for question 5: Statistics
Show answer
(i)

Cumulative frequency table (less than type):

| Screen Time (hrs/week) | Frequency | Cumulative Frequency |
|------------------------|-----------|----------------------|
| Less than 5 | 4 | 4 |
| Less than 10 | 8 | 12 |
| Less than 15 | 14 | 26 |
| Less than 20 | 20 | 46 |

∴ The cumulative frequency for 'less than 20' is 46.

---

(ii)

For the less than ogive, each point is plotted as (upper class boundary, cumulative frequency up to that boundary).

For class 15–20: upper boundary = 20, cumulative frequency = 4 + 8 + 14 + 20 = 46.

∴ The point to be plotted on the less than ogive for class 15–20 is (20, 46).

---

(iii)

Complete cumulative frequency table:

| Screen Time (hrs/week) | Frequency (f) | Cumulative Frequency (cf) |
|------------------------|---------------|--------------------------|
| 0–5 | 4 | 4 |
| 5–10 | 8 | 12 |
| 10–15 | 14 | 26 |
| 15–20 | 20 | 46 |
| 20–25 | 10 | 56 |
| 25–30 | 4 | 60 |

Here, n = Σfᵢ = 60 ⟹ n/2 = 30.

The median class is the class whose cumulative frequency first exceeds n/2 = 30.

cf just before class 15–20 = 26 < 30, and cf up to 15–20 = 46 ≥ 30.

∴ Median class = 15–20.

Using the Median formula:

Median = l + [(n/2 − cf) / f] × h

where l = 15, cf = 26, f = 20, h = 5.

⟹ Median = 15 + [(30 − 26) / 20] × 5

⟹ Median = 15 + [4/20] × 5

⟹ Median = 15 + 1

Median screen time = 16 hours per week.

*(Ogive verification: On the less than ogive, a horizontal line drawn from 30 on the y-axis meets the curve in the class 15–20; the perpendicular dropped from that point to the x-axis touches at x = 16, confirming the median.)*
Q6Case-based4 marks

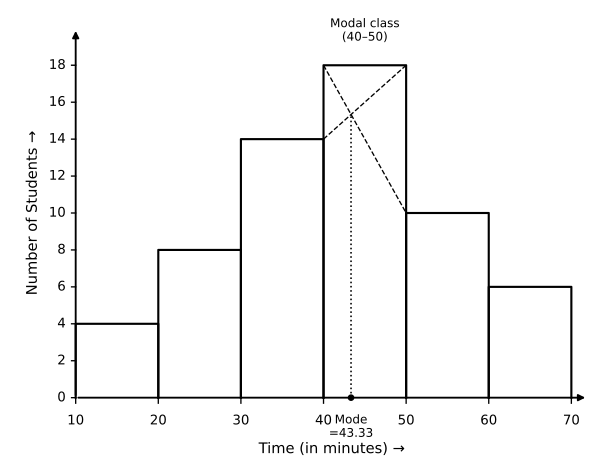
A school health committee conducted a fitness survey of 60 students in Class 10. The time (in minutes) each student spends on physical activity per day was recorded and grouped as shown in the table. The committee wishes to analyse the data to understand the central tendency of students' physical activity habits.

A school health committee conducted a fitness survey of 60 students in Class 10. The time (in minutes) each student spends on physical activity per day was recorded and grouped as follows:

| Time (in minutes) | Number of Students |
|-------------------|--------------------|
| 10 – 20 | 4 |
| 20 – 30 | 8 |
| 30 – 40 | 14 |
| 40 – 50 | 18 |
| 50 – 60 | 10 |
| 60 – 70 | 6 |

The committee wishes to analyse the data to understand the central tendency of students' physical activity habits.

(i) Find the modal class and hence calculate the Mode of the data. [1]
(ii) Using the assumed mean method with a = 45, calculate the Mean time spent on physical activity. [1]
(iii) Find the Median time spent on physical activity. Hence verify the empirical relationship: Mode = 3 × Median − 2 × Mean. [2]

Diagram for question 6: Statistics
Show answer
(i) The class with the highest frequency is 40–50, with frequency 18.
∴ Modal class = 40–50

Using the Mode formula:
Mode = l + [(f₁ − f₀) / (2f₁ − f₀ − f₂)] × h

where l = 40, f₁ = 18, f₀ = 14, f₂ = 10, h = 10

⟹ Mode = 40 + [(18 − 14) / (2×18 − 14 − 10)] × 10
⟹ Mode = 40 + [4 / (36 − 24)] × 10
⟹ Mode = 40 + (4/12) × 10
⟹ Mode = 40 + 40/12
⟹ Mode = 40 + 3.33
∴ Mode = 43.33 minutes

---

(ii) Let assumed mean a = 45, h = 10.

Construct the table for assumed mean method:

| Class | fᵢ | xᵢ (mid-value) | dᵢ = xᵢ − a | fᵢdᵢ |
|---------|----|----------------|-------------|------|
| 10–20 | 4 | 15 | −30 | −120 |
| 20–30 | 8 | 25 | −20 | −160 |
| 30–40 | 14 | 35 | −10 | −140 |
| 40–50 | 18 | 45 | 0 | 0 |
| 50–60 | 10 | 55 | 10 | 100 |
| 60–70 | 6 | 65 | 20 | 120 |
| Total | 60 | | | −200 |

n = Σfᵢ = 60, Σfᵢdᵢ = −200

Mean = a + (Σfᵢdᵢ / Σfᵢ)
⟹ Mean = 45 + (−200 / 60)
⟹ Mean = 45 − 3.33
∴ Mean = 41.67 minutes

---

(iii) Construct the cumulative frequency table:

| Class | fᵢ | Cumulative Frequency (cf) |
|---------|----|---------------------------|
| 10–20 | 4 | 4 |
| 20–30 | 8 | 12 |
| 30–40 | 14 | 26 |
| 40–50 | 18 | 44 |
| 50–60 | 10 | 54 |
| 60–70 | 6 | 60 |

n = 60 ⟹ n/2 = 30

The cumulative frequency first exceeding 30 is 44, corresponding to class 40–50.
∴ Median class = 40–50

Using the Median formula:
Median = l + [(n/2 − cf) / f] × h

where l = 40, cf = 26, f = 18, h = 10

⟹ Median = 40 + [(30 − 26) / 18] × 10
⟹ Median = 40 + (4/18) × 10
⟹ Median = 40 + 40/18
⟹ Median = 40 + 2.22
∴ Median = 42.22 minutes

Verification of Empirical Relationship: Mode = 3 × Median − 2 × Mean

RHS = 3 × 42.22 − 2 × 41.67
⟹ RHS = 126.66 − 83.34
⟹ RHS = 43.32 ≈ 43.33

LHS = Mode = 43.33

∴ LHS ≈ RHS

Hence, the empirical relationship Mode = 3 × Median − 2 × Mean is verified.
Q7Case-based4 marks

A municipal corporation conducted a survey on the monthly electricity consumption (in units) of 60 households in a residential colony. The data collected was organized into the following frequency distribution table: Monthly Consumption (in units): 0–50, 50–100, 100–150, 150–200, 200–250, 250–300; Number of Households: 4, 8, 14, 18, 10, 6. The corporation wants to analyze this data using ogives to determine the median consumption and make decisions about electricity supply.

A municipal corporation conducted a survey on the monthly electricity consumption (in units) of 60 households in a residential colony. The data collected was organized into the following frequency distribution table: Monthly Consumption (in units): 0–50, 50–100, 100–150, 150–200, 200–250, 250–300; Number of Households: 4, 8, 14, 18, 10, 6. The corporation wants to analyze this data using ogives to determine the median consumption and make decisions about electricity supply.

Diagram for question 7: Statistics
Show answer
(i)

| Class | Frequency | Cumulative Frequency (less than) |
|-------|-----------|----------------------------------|
| 0–50 | 4 | 4 |
| 50–100 | 8 | 12 |
| 100–150 | 14 | 26 |
| 150–200 | 18 | 44 |
| 200–250 | 10 | 54 |
| 250–300 | 6 | 60 |

The cumulative frequency corresponding to the upper boundary of class 150–200 is 26 + 18 = 44.

∴ The cumulative frequency of the class 150–200 is 44.

---

(ii)

For a 'more than' ogive, the cumulative frequency at a lower class boundary = Total frequency − cumulative frequency of all classes below that boundary.

Total n = 60.

Cumulative frequency of all classes below 100 = 4 + 8 = 12.

⟹ 'More than' cumulative frequency at lower boundary 100 = 60 − 12 = 48.

∴ The 'more than' cumulative frequency at 100 units is 48.

---

(iii)

Cumulative frequency table (less than type):

| Class | Frequency (f) | Cumulative Frequency (cf) |
|-------|--------------|--------------------------|
| 0–50 | 4 | 4 |
| 50–100 | 8 | 12 |
| 100–150 | 14 | 26 |
| 150–200 | 18 | 44 |
| 200–250 | 10 | 54 |
| 250–300 | 6 | 60 |

n = 60, ∴ n/2 = 30.

The cumulative frequency first exceeding 30 is 44, which belongs to the class 150–200.

∴ Median class = 150–200, where l = 150, cf = 26, f = 18, h = 50.

Applying the Median formula:

Median = l + [(n/2 − cf) / f] × h

⟹ Median = 150 + [(30 − 26) / 18] × 50

⟹ Median = 150 + [4/18] × 50

⟹ Median = 150 + 200/18

⟹ Median = 150 + 11.11

∴ The median monthly electricity consumption is approximately 161.11 units.
Q8Case-based4 marks

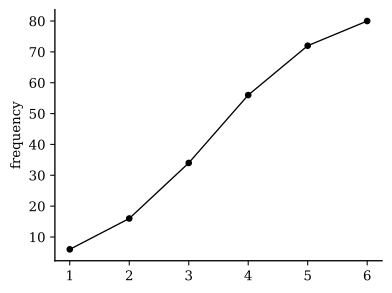
A hospital recorded the ages (in years) of 80 patients admitted to its emergency ward during a particular month. The data was grouped into class intervals as shown below:

| Age (in years) | 10–20 | 20–30 | 30–40 | 40–50 | 50–60 | 60–70 |
|---|---|---|---|---|---|---|
| Number of Patients | 6 | 10 | 18 | 22 | 16 | 8 |

The hospital administration wants to analyse the age distribution using cumulative frequency methods to determine the median age and draw ogives for better understanding.

A hospital recorded the ages (in years) of 80 patients admitted to its emergency ward during a particular month. The data was grouped into class intervals as shown below:

| Age (in years) | 10–20 | 20–30 | 30–40 | 40–50 | 50–60 | 60–70 |
|---|---|---|---|---|---|---|
| Number of Patients | 6 | 10 | 18 | 22 | 16 | 8 |

The hospital administration wants to analyse the age distribution using cumulative frequency methods to determine the median age and draw ogives for better understanding.

Diagram for question 8: Statistics
Show answer
(i)

Cumulative frequency table ('less than' type):

| Age (in years) | Frequency | Cumulative Frequency |
|---|---|---|
| Less than 20 | 6 | 6 |
| Less than 30 | 10 | 16 |
| Less than 40 | 18 | 34 |
| Less than 50 | 22 | 56 |
| Less than 60 | 16 | 72 |
| Less than 70 | 8 | 80 |

Cumulative frequency up to 40 (i.e., up to the end of class 30–40):

= 6 + 10 + 18 ⟹ ∴ Cumulative frequency = 34

---

(ii)

For the 'more than' ogive, the cumulative frequency corresponding to 'more than 40' counts all patients in classes 40–50, 50–60, and 60–70.

= 22 + 16 + 8 ⟹ ∴ Cumulative frequency for 'more than 40' = 46

---

(iii)

Cumulative Frequency Table:

| Age (in years) | Number of Patients (f) | Cumulative Frequency (cf) |
|---|---|---|
| 10–20 | 6 | 6 |
| 20–30 | 10 | 16 |
| 30–40 | 18 | 34 |
| 40–50 | 22 | 56 |
| 50–60 | 16 | 72 |
| 60–70 | 8 | 80 |

Here, n = Σfᵢ = 80 ⟹ n/2 = 40.

The median class is the class whose cumulative frequency first exceeds n/2 = 40.

cf up to 30–40 = 34 < 40; cf up to 40–50 = 56 ≥ 40.

Median class = 40–50.

Applying the Median formula:


where l = 40, n/2 = 40, cf = 34, f = 22, h = 10.


∴ Median age ≈ 42.73 years.
Q9MCQ1 mark

Consider the following frequency distribution of the daily wages (in ₹) of 60 workers in a factory:

Daily Wages (₹): 100–120, 120–140, 140–160, 160–180, 180–200
Number of Workers: 8, 12, 20, 14, 6

The sum of the lower limits of the median class and the modal class is:

Show answer
Option (A) is correct.

Explanation: Using Median class: n = 60 ⟹ n/2 = 30. Cumulative frequencies: 100–120: 8; 120–140: 20; 140–160: 40; 160–180: 54; 180–200: 60. The cumulative frequency first exceeds 30 in the class 140–160 (cf = 40, previous cf = 20), ∴ median class = 140–160, lower limit = 140. Modal class has the highest frequency = 20 (class 140–160), ∴ modal class = 140–160, lower limit = 140. ∴ Sum = 140 + 140 = 280.
Q10MCQ1 mark

The following frequency distribution shows the number of patients admitted per day in a hospital over 90 days:

| Patients per Day | 0–10 | 10–20 | 20–30 | 30–40 | 40–50 |
|---|---|---|---|---|---|
| Number of Days | 8 | 17 | 29 | 24 | 12 |

The median of the above data is:

Show answer
Option (B) is correct.

Explanation: n = Σfᵢ = 8 + 17 + 29 + 24 + 12 = 90, so n/2 = 45. Cumulative frequencies: 0–10: 8; 0–20: 25; 0–30: 54. Since cf first exceeds 45 in the class 20–30, the median class is 20–30, with l = 20, cf = 25, f = 29, h = 10. Median = l + [(n/2 − cf)/f] × h = 20 + [(45 − 25)/29] × 10 = 20 + 200/29 ≈ 20 + 6.90 = 26.90.
Q11MCQ1 mark

Consider the following frequency distribution of the number of hours of screen time per day recorded for 80 students:

| Screen Time (hours) | 0–2 | 2–4 | 4–6 | 6–8 | 8–10 |
|---|---|---|---|---|---|
| Number of Students | 5 | 13 | 24 | 26 | 12 |

The lower limit of the median class is:

Show answer
Option (A) is correct.

Explanation: n = Σfᵢ = 80, so n/2 = 40. The cumulative frequencies are: 0–2: 5; 0–4: 18; 0–6: 42; 0–8: 68; 0–10: 80. The median class is the class whose cumulative frequency first exceeds n/2 = 40, which is the class 4–6 (cf = 42). ∴ the lower limit of the median class is 4.
Q12MCQ1 mark

The following frequency distribution shows the number of books borrowed from a library each week over 60 weeks:

| Books Borrowed | 10–20 | 20–30 | 30–40 | 40–50 | 50–60 |
|---|---|---|---|---|---|
| Number of Weeks | 5 | 8 | 16 | 22 | 9 |

The sum of the lower limits of the median class and the modal class is:

Show answer
Option (C) is correct.

Explanation: n = 60, so n/2 = 30. The cumulative frequencies are: 10–20 → 5; 20–30 → 13; 30–40 → 29; 40–50 → 51. The cumulative frequency first exceeding 30 is 51, so the median class is 40–50 (lower limit = 40). The class with the highest frequency is 40–50 (f = 22), so the modal class is also 40–50 (lower limit = 40). ∴ Sum of lower limits = 40 + 40 = 80.
Q13MCQ1 mark

Consider the following frequency distribution of the number of pages read per day by 50 students:

| Pages per Day | 0–8 | 8–16 | 16–24 | 24–32 | 32–40 |
|---|---|---|---|---|---|
| Number of Students | 4 | 9 | 18 | 13 | 6 |

The sum of the lower limits of the median class and the modal class is:

Show answer
Option (B) is correct.

Explanation: For median class, n/2 = 50/2 = 25. Cumulative frequencies: 0–8: 4; 0–16: 13; 0–24: 31. Since cf first exceeds 25 in the class 16–24, the median class is 16–24 (lower limit = 16). For modal class, the highest frequency is 18, corresponding to class 16–24, so the modal class is also 16–24 (lower limit = 16). ∴ Sum of lower limits = 16 + 16 = 32.
Q14MCQ1 mark

Consider the following frequency distribution of the number of books read by 60 students in a year:

| Number of Books | 0–4 | 4–8 | 8–12 | 12–16 | 16–20 |
|---|---|---|---|---|---|
| Number of Students | 7 | 12 | 20 | 14 | 7 |

The sum of the lower limits of the median class and the modal class is:

Show answer
Option (B) is correct.

Explanation: For median class, n = 60 ⟹ n/2 = 30. Cumulative frequencies: 0–4: 7; 0–8: 19; 0–12: 39. Since cf first exceeds 30 in the class 8–12 (cf goes from 19 to 39), the median class is 8–12, lower limit = 8. For modal class, the highest frequency is 20, corresponding to class 8–12, lower limit = 8. ∴ Sum = 8 + 8 = 16.
Q15MCQ1 mark

Consider the following frequency distribution of the number of books read by 60 students in a year:

| Number of Books | 0–6 | 6–12 | 12–18 | 18–24 | 24–30 |
|---|---|---|---|---|---|
| Number of Students | 5 | 12 | 20 | 16 | 7 |

The sum of the lower limits of the median class and the modal class is:

Show answer
Option (C) is correct.

Explanation: For n = 60, n/2 = 30. The cumulative frequencies are: 0–6: 5, 6–12: 17, 12–18: 37, 18–24: 53, 24–30: 60. The cumulative frequency first exceeds 30 in the class 12–18, so the median class is 12–18 with lower limit 12. The highest frequency is 20, corresponding to class 12–18, so the modal class is also 12–18 with lower limit 12. ∴ Sum of lower limits = 12 + 12 = 24.
Q16MCQ1 mark

If the mean and mode of a frequency distribution are 45 and 33 respectively, then its median is:

Show answer
Option (B) is correct.

Explanation: By the empirical relationship Mode = 3·Median − 2·Mean, substituting Mode = 33 and Mean = 45 ⟹ 33 = 3·Median − 2×45 ⟹ 3·Median = 33 + 90 = 123 ⟹ Median = 41.
Q17MCQ1 mark

For a frequency distribution, if the mean is 36 and the mode is 24, then the median of the distribution is:

Show answer
Option (B) is correct.

Explanation: By the empirical relationship Mode = 3 × Median − 2 × Mean, substituting Mode = 24 and Mean = 36: 24 = 3 × Median − 2 × 36 ⟹ 3 × Median = 24 + 72 = 96 ⟹ Median = 32.
Q18MCQ1 mark

The median class of the following frequency distribution of the number of customers visiting a store over 50 days is:

| Customers | 0–20 | 20–40 | 40–60 | 60–80 | 80–100 | 100–120 |
|---|---|---|---|---|---|---|
| Number of Days | 4 | 6 | 14 | 16 | 8 | 2 |

Show answer
Option (B) is correct.

Explanation: The median class is the class whose cumulative frequency first exceeds n/2. Here n = Σfᵢ = 50, so n/2 = 25. The cumulative frequencies are: 0–20: 4; 0–40: 10; 0–60: 24; 0–80: 40. Since the cumulative frequency 40 (for class 60–80) is the first to exceed 25, the median class is 60–80.
Q19MCQ1 mark

The following frequency distribution shows the number of hours spent on studying per week by 40 students:

| Study Hours | 0–5 | 5–10 | 10–15 | 15–20 | 20–25 |
|---|---|---|---|---|---|
| Number of Students | 3 | 7 | 13 | 12 | 5 |

The lower limit of the median class is:

Show answer
Option (B) is correct.

Explanation: For a grouped frequency distribution, the median class is the class whose cumulative frequency first exceeds n/2. Here n = 40, so n/2 = 20. The cumulative frequencies are: 0–5 → 3; 5–10 → 10; 10–15 → 23. Since 23 is the first cumulative frequency to exceed 20, the median class is 10–15, whose lower limit is 10.
Q20MCQ1 mark

For a frequency distribution, if mean = 42 and mode = 36, then the median of the distribution is:

Show answer
Option (B) is correct.

Explanation: By the empirical relationship Mode = 3 Median − 2 Mean, substituting Mode = 36 and Mean = 42: 36 = 3 × Median − 2 × 42 ⟹ 3 × Median = 36 + 84 = 120 ⟹ Median = 40.
Q21MCQ1 mark

A data set of 25 distinct observations is arranged in ascending order. The median of this data set is 38. If each observation is decreased by 5, the median of the new data set will be:

Show answer
Option (A) is correct.

Explanation: For a data set of 25 observations arranged in ascending order, the median is the 13th observation = 38. When each observation is decreased by 5, every value shifts down by 5 while the relative order remains unchanged, so the new 13th observation = 38 − 5 = 33. ∴ The new median is 33.
Q22MCQ1 mark

The following frequency distribution shows the number of calls received per hour at a customer care centre over 80 hours:

| Calls per Hour | 0–8 | 8–16 | 16–24 | 24–32 | 32–40 |
|---|---|---|---|---|---|
| Number of Hours | 6 | 14 | 22 | 25 | 13 |

The sum of the lower limits of the median class and the modal class is:

Show answer
Option (B) is correct.

Explanation: n = 80 ⟹ n/2 = 40. Cumulative frequencies: 0–8: 6; 8–16: 20; 16–24: 42; 24–32: 67; 32–40: 80. The median class is the class whose cumulative frequency first exceeds n/2 = 40, which is 16–24 (cf = 42); lower limit = 16. The modal class is the class with the highest frequency = 25, which is 24–32; lower limit = 24. ∴ Sum = 16 + 24 = 40.
Q23MCQ1 mark

The median of a set of 11 distinct observations is 34. If each observation in the set is multiplied by 3, then the median of the new set will be:

Show answer
Option (C) is correct.

Explanation: For 11 observations arranged in ascending order, the median is the ⌈(11+1)/2⌉ = 6th observation = 34. When each observation is multiplied by 3 (a positive constant), the order is preserved and the new 6th observation = 34 × 3 = 102. ∴ the median of the new set = 102.
Q24MCQ1 mark

Consider the following frequency distribution of daily wages (in ₹) earned by workers in a factory:

Daily Wages (₹): 100–120, 120–140, 140–160, 160–180, 180–200
Number of Workers: 8, 14, 23, 18, 7

The sum of the lower limits of the median class and the modal class is:

Show answer
Option (A) is correct.

Explanation: n = Σfᵢ = 8 + 14 + 23 + 18 + 7 = 70, so n/2 = 35. Cumulative frequencies are 8, 22, 45, 63, 70. The cumulative frequency first exceeds 35 in the class 140–160 (cf = 45), so the median class is 140–160 and its lower limit = 140. The modal class is the class with the highest frequency = 23, which is also 140–160, giving lower limit = 140. ∴ Sum = 140 + 140 = 280.
Q25MCQ1 mark

Consider the following frequency distribution of the number of minutes spent on exercise per day by 70 adults:

| Time (minutes) | 0–10 | 10–20 | 20–30 | 30–40 | 40–50 |
|---|---|---|---|---|---|
| Number of Adults | 6 | 11 | 23 | 22 | 8 |

The sum of the lower limits of the median class and the modal class is:

Show answer
Option (B) is correct.

Explanation: Cumulative frequencies: 0–10 → 6; 10–20 → 17; 20–30 → 40; 30–40 → 62; 40–50 → 70. Here n = 70, so n/2 = 35. The cumulative frequency first exceeds 35 in the class 20–30 (cf = 40), so the median class is 20–30 with lower limit = 20. The modal class is the class with the highest frequency; frequencies are 6, 11, 23, 22, 8, so the highest frequency is 23, giving modal class 20–30 with lower limit = 20. ∴ Sum of lower limits = 20 + 20 = 40.
Q26MCQ1 mark

For a frequency distribution, if the mean is 36 and the mode is 30, then the median of the distribution is:

Show answer
Option (A) is correct.

Explanation: By the empirical relationship, Mode = 3·Median − 2·Mean ⟹ 30 = 3·Median − 2×36 ⟹ 3·Median = 30 + 72 = 102 ⟹ Median = 34.
Q27MCQ1 mark

A data set of 31 distinct observations is arranged in ascending order. The median of this data set is 52. If each observation is multiplied by 3, the median of the new data set will be:

Show answer
Option (C) is correct.

Explanation: For a data set of 31 observations arranged in ascending order, the median is the ((31+1)/2) = 16th observation = 52. When each observation is multiplied by 3, every value in the ordered set is scaled by 3, so the new 16th observation = 3 × 52 = 156. ∴ the median of the new data set is 156.
Q28MCQ1 mark

Consider the following frequency distribution of the daily wages (in ₹) of 60 workers in a factory:

| Daily Wages (₹) | 100–150 | 150–200 | 200–250 | 250–300 | 300–350 |
|---|---|---|---|---|---|
| Number of Workers | 8 | 14 | 10 | 22 | 6 |

The sum of the lower limits of the median class and the modal class is:

Show answer
Option (B) is correct.

Explanation: Cumulative frequencies: 100–150: 8; 150–200: 22; 200–250: 32; 250–300: 54; 300–350: 60. Here N = 60, so N/2 = 30. The median class is the class whose cumulative frequency first exceeds 30; since cf up to 200–250 is 32 ≥ 30 and cf up to 150–200 is 22 < 30, the median class is 200–250, with lower limit = 200. The modal class is the class with the highest frequency; frequencies are 8, 14, 10, 22, 6, so the modal class is 250–300, with lower limit = 250. ∴ Sum of lower limits = 200 + 250 = 450.
Q29MCQ1 mark

The following frequency distribution shows the number of laptops repaired per week by a technician over 50 weeks:

| Laptops Repaired | 0–4 | 4–8 | 8–12 | 12–16 | 16–20 |
|---|---|---|---|---|---|
| Number of Weeks | 6 | 10 | 18 | 11 | 5 |

The median of the above data is:

Show answer
Option (B) is correct.

Explanation: Using the Median formula: Median = l + [(n/2 − cf)/f] × h. Here n = 50, so n/2 = 25. Cumulative frequencies: 0–4: 6; 0–8: 16; 0–12: 34. Since cf first exceeds 25 in the class 8–12, the median class is 8–12, giving l = 8, cf = 16, f = 18, h = 4. ⟹ Median = 8 + [(25 − 16)/18] × 4 = 8 + (9/18) × 4 = 8 + 2 = 10.
Q30MCQ1 mark

The following frequency distribution shows the number of books read per month by 40 members of a library club:

| Books per Month | 1–4 | 4–7 | 7–10 | 10–13 | 13–16 |
|---|---|---|---|---|---|
| Number of Members | 3 | 7 | 12 | 11 | 7 |

The sum of the lower limits of the median class and the modal class is:

Show answer
Option (B) is correct.

Explanation: For n = 40, n/2 = 20. The cumulative frequencies are: 1–4 → 3, 4–7 → 10, 7–10 → 22, 10–13 → 33, 13–16 → 40. The median class is the class whose cumulative frequency first exceeds n/2 = 20, which is 7–10 (cf = 22); its lower limit = 7. The modal class is the class with the highest frequency = 12, which is also 7–10; its lower limit = 7. ∴ Required sum = 7 + 7 = 14.

Want unlimited practice on Statistics?

The full ClearSteps bank has 76+ reviewed questions on this chapter alone — with step-wise solutions, difficulty levels, and progress tracking. Verify your WhatsApp number and your free trial starts right here.

CBSE · CLASS 10
🎟️14-day free trial · code PRAC auto-applied
Mobile Number
+91
OTP will be sent to your WhatsApp

⭐ Trusted by 12,000+ students across India

Statistics — Class 10 Maths Practice Questions