ClearStepsCLEARSTEPS AI
Teacher Login →Student Login →

Biodiversity and Conservation: Class 12 Biology Practice Questions

30 original exam-pattern questions with full answers, matched to the current CBSE Class 12 paper design, including case-based questions. Attempt each question before opening the answer — or start a free 14-day trial ↓ for the full bank.

Q1Case-based4 marks

A team of wildlife biologists conducted surveys in two forest regions of India — Region A (Western Ghats) and Region B (a degraded forest patch in central India). In Region A, they recorded 1,200 plant species, of which 450 were endemic (found nowhere else on Earth). The original forest cover of Region A has been reduced to less than 25% of its historical extent due to agriculture and urbanisation. In Region B, they recorded 300 plant species with no endemic species, and the forest cover was 60% of its historical extent.

Read the following passage and answer the questions that follow:

A team of wildlife biologists conducted surveys in two forest regions of India — Region A (Western Ghats) and Region B (a degraded forest patch in central India). In Region A, they recorded 1,200 plant species, of which 450 were endemic (found nowhere else on Earth). The original forest cover of Region A has been reduced to less than 25% of its historical extent due to agriculture and urbanisation. In Region B, they recorded 300 plant species with no endemic species, and the forest cover was 60% of its historical extent.

(i) Based on the criteria used to designate biodiversity hotspots, which of the two regions — A or B — qualifies as a biodiversity hotspot? Give TWO reasons to justify your answer.

(ii) The biologists observed that Region A had a much steeper species–area relationship curve (higher value of slope 'z') compared to Region B. What does a higher 'z' value indicate about species diversity in Region A?

(iii) Suggest ONE in-situ and ONE ex-situ conservation measure that can be implemented specifically to protect the endemic plant species of Region A.

Show answer
CBSE MARKING SCHEME — CASE STUDY (4 marks)

─────────────────────────────────────────
(i) Region A qualifies as a biodiversity hotspot. (1 + 1 = 2 marks)

Reason 1 (1 mark): Region A has a very high level of endemism — 450 out of 1,200 recorded plant species are endemic (found nowhere else on Earth). High endemism (a large proportion of species unique to that region) is one of the two key criteria for designating a biodiversity hotspot. Region B, by contrast, has NO endemic species and therefore fails this criterion entirely.

Reason 2 (1 mark): Region A has suffered massive habitat loss — its original forest cover has been reduced to less than 25% of its historical extent, meaning more than 75% of its original habitat has already been destroyed. This exceeds the required threshold of more than 70% habitat loss (i.e., less than 30% of original habitat remaining) that is the second key criterion for hotspot designation. Region B retains 60% of its forest cover (only ~40% lost), which does NOT meet this threshold.

─────────────────────────────────────────
(ii) Higher 'z' value in the species–area relationship: (1 mark)

A higher value of 'z' (slope) in Region A indicates that species richness increases more steeply with increasing area — that is, even a small increase in area adds a disproportionately large number of new species. This reflects that Region A is exceptionally species-rich and biodiverse; higher 'z' values (typically 0.6 to 1.2) are characteristic of large continental areas or biodiversity hotspots where species diversity is very high and species are not uniformly distributed across the landscape.

─────────────────────────────────────────
(iii) Conservation measures for endemic plant species of Region A: (1 + 1 = 2 marks)

In-situ conservation measure (1 mark): Declaring Region A (or critical parts of it) as a Protected Area such as a National Park, Wildlife Sanctuary, or Biosphere Reserve so that the natural habitat of the endemic plant species is legally protected from further destruction due to agriculture and urbanisation.

Ex-situ conservation measure (1 mark): Establishing a Seed Bank (or Botanical Garden / cryopreservation of endemic plant germplasm) where seeds or tissue samples of the endemic plant species of Region A are collected and preserved outside their natural habitat, ensuring their survival even if the wild populations are lost.

─────────────────────────────────────────
Q2Case-based4 marks

The Aravalli Hills in Rajasthan once supported rich dry deciduous forest, but over the past five decades, large tracts have been cleared for marble quarrying and agricultural expansion. A survey conducted in 2023 found that the area had lost more than 75% of its original forest cover. Several plant species found nowhere else in this region have disappeared. A local NGO proposed that two measures be adopted: (i) setting up a seed bank in Jaipur to preserve plant germplasm, and (ii) declaring the remaining forest patches as a Wildlife Sanctuary. Meanwhile, an ecologist noted that the introduction of Prosopis juliflora (an exotic thorny shrub introduced decades ago for afforestation) was spreading aggressively, replacing the native grass species and reducing the food available for native herbivores.

Read the following passage carefully and answer the questions that follow:

The Aravalli Hills in Rajasthan once supported rich dry deciduous forest, but over the past five decades, large tracts have been cleared for marble quarrying and agricultural expansion. A survey conducted in 2023 found that the area had lost more than 75% of its original forest cover. Several plant species found nowhere else in this region have disappeared. A local NGO proposed that two measures be adopted: (i) setting up a seed bank in Jaipur to preserve plant germplasm, and (ii) declaring the remaining forest patches as a Wildlife Sanctuary. Meanwhile, an ecologist noted that the introduction of Prosopis juliflora (an exotic thorny shrub introduced decades ago for afforestation) was spreading aggressively, replacing the native grass species and reducing the food available for native herbivores.

(a) Based on the passage, does the Aravalli Hills region qualify as a 'Biodiversity Hotspot'? Justify your answer by applying BOTH criteria used to designate a region as a hotspot. (2 marks)

(b) Classify the two conservation measures proposed by the NGO into the correct categories and give ONE additional example of each category from India. (1 mark)

(c) Identify the threat to biodiversity illustrated by the spread of Prosopis juliflora in the passage. Name ONE other Indian example of such a threat and state how it harms native biodiversity. (1 mark)

Show answer
CBSE MARKING SCHEME — TOTAL: 4 MARKS

─────────────────────────────────────
(a) Does the Aravalli Hills region qualify as a Biodiversity Hotspot? [2 marks]
─────────────────────────────────────
A region is designated as a Biodiversity Hotspot if and only if it satisfies BOTH of the following criteria:

Criterion 1: It must contain more than 1,500 species of endemic vascular plants (species found nowhere else on Earth).
• From the passage: 'Several plant species found nowhere else in this region have disappeared.' This suggests the region DID have endemic plant species, satisfying (or having the potential to satisfy) this criterion. [½ mark]

Criterion 2: It must have lost more than 70% of its original habitat.
• From the passage: The region has lost more than 75% of its original forest cover — this exceeds the 70% threshold. [½ mark]

Conclusion: Based on the passage, the Aravalli Hills region satisfies BOTH criteria (presence of endemic species + >70% habitat loss) and thus qualifies for consideration as a Biodiversity Hotspot. [1 mark for correct justified conclusion applying both criteria]

Note: Award 2 marks only if BOTH criteria are correctly applied with evidence from the passage. Award 1 mark if only one criterion is identified and applied correctly.

─────────────────────────────────────
(b) Classification of the two conservation measures [1 mark]
─────────────────────────────────────

• Measure (i) — Setting up a seed bank in Jaipur:
→ Ex-situ conservation (conservation outside the natural habitat).
→ Additional Indian example: National Botanical Research Institute, Lucknow / National Bureau of Plant Genetic Resources (NBPGR), New Delhi / Zoological parks (e.g., National Zoological Park, Delhi). [½ mark]

• Measure (ii) — Declaring remaining forest patches as a Wildlife Sanctuary:
→ In-situ conservation (conservation within the natural habitat).
→ Additional Indian example: Biosphere Reserves (e.g., Nilgiri Biosphere Reserve) / National Parks (e.g., Jim Corbett National Park) / Sacred groves (e.g., Khasi Hills, Meghalaya). [½ mark]

Award ½ + ½ = 1 mark.

─────────────────────────────────────
(c) Threat illustrated by Prosopis juliflora [1 mark]
─────────────────────────────────────

• Name of threat: Introduction of invasive/alien species (also accept: biological invasion / invasive alien species). [½ mark]

• One other Indian example + mechanism of harm (any ONE of the following):

- Lantana camara (introduced as ornamental plant): spreads rapidly in forest understoreys, suppresses growth of native plant species by competing for light, space, and nutrients, reducing biodiversity of native flora. [½ mark]

OR

- Parthenium hysterophorus (carrot weed/congress grass, introduced from North America): causes allergic reactions in humans and livestock, outcompetes native grasses and reduces plant biodiversity. [½ mark]

OR

- Water hyacinth (Eichhornia crassipes — 'terror of Bengal'): grows rapidly on water surfaces, depletes dissolved oxygen in water bodies, blocks sunlight, and causes death of aquatic organisms, disrupting the native aquatic ecosystem. [½ mark]

Award ½ + ½ = 1 mark.

─────────────────────────────────────
SUMMARY OF MARKS:
(a) Hotspot criteria applied to passage — 2 marks
(b) Ex-situ + In-situ with Indian examples — 1 mark
(c) Invasive species threat + Indian example with mechanism — 1 mark
TOTAL = 4 marks
─────────────────────────────────────
Q3Case-based4 marks

A team of ecologists surveyed two forest patches in the Western Ghats — Forest A (500 km²) and Forest B (50 km²). Both patches had similar climate and soil conditions. Forest A recorded 320 plant species, while Forest B recorded 98 plant species. The team also noted that Forest B was once part of Forest A, but was separated about 40 years ago when a highway was constructed through the region. Additionally, the ecologists observed that several exotic ornamental plant species introduced in the region had started spreading aggressively into the native forest, outcompeting local species.

Read the following case study and answer the questions that follow:

A team of ecologists surveyed two forest patches in the Western Ghats — Forest A (500 km²) and Forest B (50 km²). Both patches had similar climate and soil conditions. Forest A recorded 320 plant species, while Forest B recorded 98 plant species. The team also noted that Forest B was once part of Forest A, but was separated about 40 years ago when a highway was constructed through the region. Additionally, the ecologists observed that several exotic ornamental plant species introduced in the region had started spreading aggressively into the native forest, outcompeting local species.

(i) Using the species-area relationship, explain why Forest A has significantly more species than Forest B. Write the mathematical relationship involved. (1 mark)

(ii) The highway construction that separated Forest B from Forest A is an example of which major cause of biodiversity loss? Explain how this separation could lead to local extinction of species in Forest B. (1 mark)

(iii) Name the phenomenon by which the introduced exotic ornamental plants are outcompeting native species. Give ONE Indian example of such a species that has caused similar damage. (1 mark)

(iv) The ecologists recommend that Forest A should be declared a Wildlife Sanctuary. Identify the category of conservation this represents (in-situ or ex-situ) and state ANY TWO advantages of this type of conservation over the other. (1 mark)

Show answer
MARKING SCHEME — Case Study (4 × 1 = 4 marks)

─────────────────────────────────────────
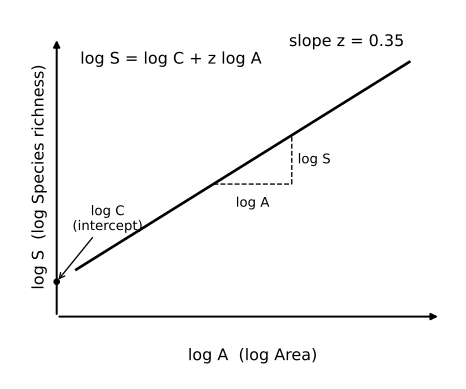
(i) Species-Area Relationship — explanation and equation (1 mark)
─────────────────────────────────────────
• The species-area relationship states that larger the area, greater the species richness found in that region.
• The relationship is expressed as:

log S = log C + Z log A

Where:
S = Species richness
A = Area of the region
Z = Regression coefficient (slope of the line; value typically 0.1–0.2 for small islands/patches; 0.6–1.2 for large continents)
C = Y-intercept (a constant)

• Forest A (500 km²) is 10 times larger than Forest B (50 km²); since species richness increases with area (as a log-log linear relationship), Forest A supports significantly more species (320) than Forest B (98).

[Award 1 mark for: correct statement of species-area relationship AND the equation log S = log C + Z log A with terms identified]

─────────────────────────────────────────
(ii) Cause of biodiversity loss — habitat fragmentation and its effect (1 mark)
─────────────────────────────────────────
• The highway construction represents HABITAT FRAGMENTATION (a component of Habitat Loss and Fragmentation — the single most important cause of biodiversity loss).

• How fragmentation leads to local extinction in Forest B:
— The smaller, isolated patch (Forest B) can no longer support large-bodied animals that require large home ranges (e.g., tigers, elephants).
— Gene flow between populations is cut off → inbreeding → reduced genetic diversity → populations become vulnerable to disease and environmental change.
— Edge effects increase (more boundary relative to interior) → interior species that need undisturbed core habitat decline.
— Any of the above effects can drive local extinction of species that cannot survive in the smaller, isolated patch.

[Award 1 mark for: correctly naming habitat fragmentation AND giving at least one valid mechanism of local extinction]

─────────────────────────────────────────
(iii) Invasive/alien species — phenomenon and Indian example (1 mark)
─────────────────────────────────────────
• The phenomenon is introduction of INVASIVE ALIEN (exotic) SPECIES.
(Also accept: biological invasion / alien species introduction)

• Mechanism: Exotic species introduced into a new region often lack natural predators/competitors → they multiply rapidly and outcompete native species → native species decline or go locally extinct.

• Indian examples (any ONE):
— Lantana camara (introduced as an ornamental plant; now invades forest floors of Indian national parks, suppressing native understorey plants)
— Parthenium hysterophorus / carrot weed (from North America; spreads aggressively, causes allergies, outcompetes native grasses)
— Water hyacinth / Eichhornia crassipes (introduced as an ornamental aquatic plant; forms dense mats, chokes water bodies, reduces light and O₂ for native aquatic species)

[Award 1 mark for: naming the phenomenon (invasive/alien species) AND giving one correct Indian example]

─────────────────────────────────────────
(iv) Type of conservation and advantages (1 mark)
─────────────────────────────────────────
• Declaring Forest A as a Wildlife Sanctuary represents IN-SITU CONSERVATION
(conservation of species in their natural habitat).

• TWO advantages of in-situ conservation over ex-situ conservation:
(Any two of the following, ½ mark each — but since minimum unit = 1 mark, award 1 mark for any two correct advantages stated together)

1. Species are conserved in their natural ecosystem along with their ecological interactions (predator-prey, pollination, seed dispersal) — entire community is protected, not just individual species.
2. It is cost-effective — a large number of species are protected simultaneously without the expense of maintaining captive facilities.
3. Species can continue to evolve naturally and adapt to changing environmental conditions — genetic diversity is maintained within natural populations.
4. It is the only feasible method for conserving species that cannot survive or reproduce in captivity.

[Award 1 mark for: correctly identifying in-situ conservation AND stating any two valid advantages]

─────────────────────────────────────────
ACCEPTABLE ALTERNATIVES:
• For (ii): 'habitat destruction' accepted if student explains fragmentation aspect; 'HIPPO' reference acceptable if fragmentation is specifically identified.
• For (iii): Any well-known Indian invasive species with correct context accepted.
• For (iv): If student writes 'biosphere reserve' or 'national park' instead of wildlife sanctuary — still award mark as all three are in-situ conservation categories.
─────────────────────────────────────────
TOTAL: 4 marks (1 + 1 + 1 + 1)
Q4Case-based4 marks

A team of ecologists studied two forest patches — Forest A and Forest B — in the Western Ghats. Forest A is a well-preserved sacred grove with minimal human interference, while Forest B is a degraded patch where large-scale logging has occurred over the past two decades. The team recorded species richness and plotted species–area relationships for both forests. They also noted that Forest A harboured several endemic plant and animal species, whereas Forest B showed dominance by a few generalist species. The ecologists concluded that Forest A qualifies as part of a globally recognised biodiversity hotspot.

Read the following passage and answer the questions that follow:

A team of ecologists studied two forest patches — Forest A and Forest B — in the Western Ghats. Forest A is a well-preserved sacred grove with minimal human interference, while Forest B is a degraded patch where large-scale logging has occurred over the past two decades. The team recorded species richness and plotted species–area relationships for both forests. They also noted that Forest A harboured several endemic plant and animal species, whereas Forest B showed dominance by a few generalist species. The ecologists concluded that Forest A qualifies as part of a globally recognised biodiversity hotspot.

(i) The ecologists plotted a species–area graph for both forests. Draw a labelled graph showing the species–area relationship. On the same graph, indicate which curve corresponds to Forest A (higher biodiversity) and which to Forest B (lower biodiversity). Label the axes and the two curves clearly. (2 marks)

(ii) Name the two criteria that MUST be met for a region to be designated as a biodiversity hotspot. Does Forest A (Western Ghats) satisfy both criteria? (1 mark)

(iii) The ecologists found that after logging in Forest B, an invasive weed spread rapidly and displaced native ground flora. Name any ONE such invasive weed known to threaten native biodiversity in India, and state ONE reason why invasive species are ecologically harmful. (1 mark)

Show answer
MARKING SCHEME — Total: 4 marks

─────────────────────────────────────
(i) Species–Area Relationship Graph [2 marks]
─────────────────────────────────────

Award 1 mark for a correctly drawn and labelled graph; 1 mark for correctly identifying and labelling both curves (Forest A steeper / higher, Forest B shallower / lower).

REQUIRED DIAGRAM (draw in answer book):

Species Richness (log S)

│ / ← Forest A
│ / (higher slope, higher biodiversity)
│ /
│ / ← Forest B
│ / (lower slope, lower biodiversity)
│/
└─────────────────────────────
Area (log A)

Full labelled diagram description:
• X-axis label: Area (log A)
• Y-axis label: Species Richness (log S)
• Two straight lines (log-log scale) starting from the origin region
– Forest A: steeper slope (higher 'z' value / higher species richness per unit area)
– Forest B: shallower slope (lower species richness per unit area)
• Both lines labelled: 'Forest A' and 'Forest B'
• Title (optional but good practice): Species–Area Relationship

Relationship equation (state in answer):
log S = log C + z log A
where S = species richness, A = area, C = y-intercept (related to geographic region/diversity), z = slope (regression coefficient).

Forest A has a steeper slope (higher z value) indicating greater species richness per unit area; Forest B has a shallower slope indicating lower species richness due to habitat degradation. [1 mark — correct graph with axes + 1 mark — both curves correctly labelled]

─────────────────────────────────────
(ii) Biodiversity Hotspot Criteria [1 mark]
─────────────────────────────────────

Two criteria (BOTH must be met):
1. The region must have more than 1,500 species of endemic vascular plants.
2. The region must have lost more than 70% of its original habitat.

Yes, Forest A (Western Ghats + Sri Lanka hotspot) satisfies BOTH criteria — it has exceptionally high plant endemism AND has experienced significant habitat loss due to human activities such as logging and agriculture. [1 mark — both criteria correctly named]

(Acceptable alternative phrasing: '>1500 endemic plant species' AND 'lost >70% of original habitat')

─────────────────────────────────────
(iii) Invasive Species — Name + Harm [1 mark]
─────────────────────────────────────

Any ONE invasive weed in India (any one acceptable):
• Parthenium hysterophorus (carrot weed / congress grass) — introduced from North America
• Lantana camara — introduced as ornamental plant
• Eichhornia crassipes (water hyacinth / 'Terror of Bengal') — aquatic invasive

ONE reason invasive species are ecologically harmful:
Invasive species outcompete native species for resources (food, space, light) → reduce native species populations → decrease local biodiversity / cause extinction of native species.

(Other acceptable reasons: alter habitat structure; disrupt food chains; introduce new diseases to which native species have no resistance.) [1 mark — correct invasive species name AND one valid ecological harm]

─────────────────────────────────────
MARK SUMMARY
(i) Graph drawn and labelled correctly = 1 mark
Forest A and Forest B curves labelled = 1 mark
(ii) Both hotspot criteria stated + Yes = 1 mark
(iii) Invasive species name + harm stated = 1 mark
TOTAL = 4 marks
─────────────────────────────────────
Q5Case-based4 marks

A team of ecologists visited two islands — Island A and Island B — to study bird species diversity. Island A had an area of 1000 km² and Island B had an area of 100 km². They recorded 200 species on Island A and 80 species on Island B. The ecologists noted that both islands had several endemic species. However, Island B had recently experienced the introduction of a non-native predatory snake, which had caused rapid decline in several native bird populations.

Read the following case study and answer the questions that follow:

A team of ecologists visited two islands — Island A and Island B — to study bird species diversity. Island A had an area of 1000 km² and Island B had an area of 100 km². They recorded 200 species on Island A and 80 species on Island B. The ecologists noted that both islands had several endemic species. However, Island B had recently experienced the introduction of a non-native predatory snake, which had caused rapid decline in several native bird populations.

(i) The ecologists used the species-area relationship to compare biodiversity on the two islands. Write the equation that describes this relationship and identify what each term represents. [2]

(ii) Draw a well-labelled graph showing the species-area relationship (log S vs log A), indicating the slope value typically observed for smaller regions. [2]

Show answer
SECTION E — CASE STUDY ANSWER

(i) Species-Area Relationship Equation: (1 + 1 = 2 marks)

The equation is:

log S = log C + z · log A

Where:
• S = Species richness (number of species recorded)
• A = Area of the geographic region (e.g., km²)
• C = Y-intercept (a constant; represents species richness when area = 1 unit)
• z = Slope of the line (regression coefficient; indicates the rate at which species richness increases with area)

[Award 1 mark for correctly writing the equation; 1 mark for correctly identifying all four terms]

Note: The relationship shows that larger areas support greater species richness. In the given case, Island A (1000 km²) supports more species (200) than Island B (100 km², 80 species), which is consistent with this relationship.

---

(ii) Labelled Graph — Species-Area Relationship (2 marks)

[Award 1 mark for correctly drawn straight-line graph on log–log axes; 1 mark for correct labels including slope value z ≈ 0.1–0.2]

DIAGRAM (to be drawn in answer book):


log S
(Species
Richness) |
| /
| /
| / ← Slope = z ≈ 0.1 to 0.2
| / (for smaller regions / islands)
| /
| /
| /
|__________/____________________
log A (Area)


Labels required on the graph:
• X-axis: log A (Area)
• Y-axis: log S (Species Richness)
• The straight line rising from lower left to upper right
• Slope labelled as z (value stated as 0.1 to 0.2 for smaller regions/islands)
• Title: Species-Area Relationship

Key fact for examiner: For smaller areas (islands, smaller geographic regions), the slope z typically has a value of 0.1 to 0.2. For very large areas (continents), z value is much steeper (0.6 to 1.2).

[Note for Visually Impaired candidates: In place of the graph, write — 'When log of species richness (log S) is plotted against log of area (log A), a straight line is obtained. The slope of this line is called z (regression coefficient). For smaller regions and islands, the value of z is typically between 0.1 and 0.2.']
Q6Case-based4 marks

A group of Class 12 students visited the Western Ghats during their field trip. Their biology teacher pointed out that this region is one of India's biodiversity hotspots. The students observed a wide variety of plant and animal species, many of which are found nowhere else in the world. The teacher also explained that due to rapid deforestation and habitat destruction over the past few decades, many species in this region are now listed as endangered or critically endangered on the IUCN Red List. To protect these species, the government has established several National Parks and Wildlife Sanctuaries in the region. The teacher further mentioned that some rare orchid species from this area are also maintained in the Botanical Gardens of nearby cities.

Read the following passage and answer the questions that follow:

A group of Class 12 students visited the Western Ghats during their field trip. Their biology teacher pointed out that this region is one of India's biodiversity hotspots. The students observed a wide variety of plant and animal species, many of which are found nowhere else in the world. The teacher also explained that due to rapid deforestation and habitat destruction over the past few decades, many species in this region are now listed as endangered or critically endangered on the IUCN Red List. To protect these species, the government has established several National Parks and Wildlife Sanctuaries in the region. The teacher further mentioned that some rare orchid species from this area are also maintained in the Botanical Gardens of nearby cities.

(a) State any ONE criterion that qualifies a region as a biodiversity hotspot. (1 mark)
(b) Name the category of IUCN Red List that refers to species facing an extremely high risk of extinction in the wild. (1 mark)
(c) The National Parks established in the Western Ghats represent one form of conservation. Name this form of conservation and give ONE other example of it mentioned in the passage. (2 marks)

Show answer
MARKING SCHEME — CASE STUDY (4 marks)

(a) Any ONE criterion that qualifies a region as a biodiversity hotspot: (1 mark)

Acceptable answers (any ONE):
• The region must have more than 1,500 endemic plant species (species found nowhere else in the world).
OR
• The region must have lost more than 70% of its original habitat.

(Award 1 mark for any one correct criterion)
(1×1=1)

---

(b) IUCN Red List category for species facing an extremely high risk of extinction in the wild: (1 mark)

• Critically Endangered (CR)

(Award 1 mark for the correct category name)
(1×1=1)

---

(c) Name of conservation form + ONE other example from the passage: (1+1=2 marks)

• Name of conservation form: In-situ conservation
(Conservation of species within their natural habitat / on-site conservation)
— Award 1 mark

• ONE other example of in-situ conservation mentioned in the passage:
Wildlife Sanctuaries
(Award 1 mark)

Note: Botanical Gardens is NOT acceptable here — it is an example of ex-situ conservation (conservation outside the natural habitat). Only National Parks and Wildlife Sanctuaries qualify as in-situ conservation from the passage.

(1×2=2)

---

TOTAL: 4 marks
Q7Case-based5 marks

A team of ecologists surveyed two forest patches in the Western Ghats — Forest A (undisturbed, 1000 km²) and Forest B (fragmented by a highway, 100 km²). They recorded species richness data and applied the Species–Area relationship to analyse biodiversity patterns.

A team of ecologists surveyed two forest patches in the Western Ghats — Forest A (undisturbed, 1000 km²) and Forest B (fragmented by a highway, 100 km²). They recorded the following species richness data:

| Forest Patch | Area (km²) | Number of Tree Species |
|---|---|---|
| Forest A | 1000 | 200 |
| Forest B | 100 | 63 |

The ecologists used the Species–Area relationship: log S = log C + Z log A, where S = number of species, A = area, C = y-intercept constant, Z = slope (regression coefficient).

(i) Using the data above, calculate the value of Z for tree species in this region. Show your working. (2 marks)

(ii) The ecologists found that Forest B had a disproportionately high number of endemic plant species despite its small size. Name the category of biodiversity this represents, and explain why endemic species in fragmented forests face a higher extinction risk than widespread species. (2 marks)

(iii) Draw a labelled graph showing the Species–Area relationship for a typical mainland region (Z ≈ 0.1–0.2) and for an island/isolated habitat (Z ≈ 0.6–1.2) on the same axes. Label both curves clearly. (1 mark)

Show answer
MARKING SCHEME — Total: 5 marks

─────────────────────────────────────
Part (i): Calculation of Z value [2 marks]
─────────────────────────────────────

Formula: log S = log C + Z log A

Applying to Forest A:
log 200 = log C + Z × log 1000
2.301 = log C + Z × 3.000 … (equation 1)

Applying to Forest B:
log 63 = log C + Z × log 100
1.799 = log C + Z × 2.000 … (equation 2)

Subtracting equation 2 from equation 1:
2.301 − 1.799 = Z × (3.000 − 2.000)
0.502 = Z × 1.000
Z = 0.502 ≈ 0.5 [1 mark — correct working/setup]

Conclusion: Z ≈ 0.5, which is intermediate between typical mainland (0.1–0.2) and island values (0.6–1.2), consistent with a partially isolated/fragmented landscape. [1 mark — correct final value with interpretation]

(Award 1 mark if method is correct but arithmetic error leads to slightly different value; award both marks only if working is shown AND value is correct.)

─────────────────────────────────────
Part (ii): Category of biodiversity + extinction risk [2 marks]
─────────────────────────────────────

• The category of biodiversity represented is Species diversity / specifically, the presence of endemic species reflects genetic and species-level biodiversity unique to that region. [1 mark]
(Accept: 'endemic species are part of species diversity'; do NOT accept 'genetic diversity' alone)

• Reason for higher extinction risk of endemic species in fragmented forests:
Endemic species have a restricted geographic range — they exist ONLY in that specific area. In a fragmented forest (small, isolated patch), any disturbance (fire, disease, human encroachment) affects their ENTIRE global population simultaneously. They cannot recolonise from neighbouring areas because of the highway barrier (habitat fragmentation reduces connectivity). Small population size also increases vulnerability to inbreeding, genetic drift, and stochastic events, all of which accelerate local extinction. [1 mark — any two valid reasons accepted]

─────────────────────────────────────
Part (iii): Labelled Species–Area graph [1 mark]
─────────────────────────────────────

DIAGRAM (draw in answer book):

log S (Number of species)
|
| / ← Islands/Isolated habitats
| / (steep slope, Z = 0.6–1.2)
| /
| / ← Mainland/Large contiguous areas
| / / (gentle slope, Z = 0.1–0.2)
| / /
| / /
|/ /
+─────────────────────────
log A (Area)

Full labelled diagram must show:
• X-axis labelled: log A (Area) }
• Y-axis labelled: log S (Number of species) } [1 mark — all
• TWO straight lines (log-log plot = straight line) } 4 labels +
• Steeper line labelled: Islands / Isolated habitats (Z = 0.6–1.2) } 2 curves
• Shallower line labelled: Mainland / Contiguous habitat (Z = 0.1–0.2) } present]

(Deduct: 0 marks if only one curve drawn; award 1 mark only if both curves AND all 4 labels are present)

─────────────────────────────────────
SUMMARY OF VALUE POINTS:
─────────────────────────────────────
(i) Correct subtraction method / equation setup — 1 mark
Correct Z value ≈ 0.5 (accept 0.50–0.51) — 1 mark
(ii) Correct category named (species diversity / endemism) — 1 mark
Valid biological reason for higher extinction risk — 1 mark
(iii) Correctly labelled two-curve log S vs log A graph — 1 mark
TOTAL = 5 marks
Q8Case-based5 marks

A group of students visited the Namdapha National Park in Arunachal Pradesh during their field trip. Their biology teacher pointed out that this park lies within one of India's recognised biodiversity hotspots and contains a large number of species found nowhere else on Earth. The teacher also explained that despite covering less than 2% of Earth's land area, such hotspot regions collectively harbour more than 50% of the world's species.

A group of students visited the Namdapha National Park in Arunachal Pradesh during their field trip. Their biology teacher pointed out that this park lies within one of India's recognised biodiversity hotspots and contains a large number of species found nowhere else on Earth. The teacher also explained that despite covering less than 2% of Earth's land area, such hotspot regions collectively harbour more than 50% of the world's species. After the visit, the teacher asked the students to reflect on the importance of conserving biodiversity.

(i) Name the biodiversity hotspot in which Namdapha National Park is located. State the TWO criteria that must be met for a region to be designated as a biodiversity hotspot. (1+1+1 = 3 marks)

(ii) The students learned that biodiversity can be studied at three different levels. Name all THREE levels of biodiversity and give ONE example for each. (1×2 = 2 marks) [Any two levels with correct examples accepted]

Show answer
MARKING SCHEME (Total: 5 marks)

──────────────────────────────────────
PART (i) — 3 marks
──────────────────────────────────────

• Name of hotspot:
Indo-Burma hotspot (also accepted: Indo-Myanmar hotspot)
→ 1 mark

• Criterion 1:
The region must have MORE THAN 1,500 species of endemic vascular plants (i.e., plant species found nowhere else on Earth).
→ 1 mark

• Criterion 2:
The region must have LOST more than 70% of its original habitat (i.e., it must be under significant threat / highly degraded).
→ 1 mark

Note to examiner: BOTH criteria must be present for a region to qualify as a hotspot. There are 34 such hotspots worldwide. India has THREE hotspots: (1) Western Ghats + Sri Lanka, (2) Himalaya (Eastern Himalayas), (3) Indo-Burma.

──────────────────────────────────────
PART (ii) — 2 marks (any TWO levels with correct examples)
──────────────────────────────────────

Three levels of biodiversity:

1. Genetic Diversity
— Diversity in the genetic makeup within individuals of the same species.
— Example: India has more than 50,000 genetically distinct varieties of rice (Oryza sativa); or more than 1,000 varieties of mango.
→ 1 mark (level name + example)

2. Species Diversity
— Diversity in the number and abundance of species in a given region (species richness).
— Example: Colombia has approximately 1,400 species of birds; Western Ghats has a high diversity of amphibian species.
→ 1 mark (level name + example)

3. Ecological (Community/Ecosystem) Diversity
— Diversity at the level of ecosystems or communities in a region — variety of habitats, ecological communities, and processes.
— Example: India has a wide range of ecosystems — rainforests, mangroves, coral reefs, grasslands, wetlands, and deserts.
→ 1 mark (level name + example)

Award any TWO correct level–example pairs for full 2 marks. (1×2 = 2)

──────────────────────────────────────
VALUE POINTS SUMMARY
──────────────────────────────────────
(i) Name of hotspot — 1 mark
(i) Criterion 1: >1,500 endemic plant species — 1 mark
(i) Criterion 2: >70% original habitat lost — 1 mark
(ii) Any TWO of three levels with correct examples — 1+1 = 2 marks

TOTAL: 5 marks
Q9MCQ1 mark

A small island in the Pacific Ocean was colonised by 30 individuals of a bird species that accidentally arrived from a large mainland population. After several generations, the island population showed a much lower genetic diversity compared to the mainland population, even though no selection pressure was acting on them. Which of the following BEST explains this observation?

Show answer
Correct answer: (B) Founder effect, because the small colonising group carried only a fraction of the mainland gene pool.

Reason (value point — 1 mark):
The founder effect is a type of genetic drift in which a small group of individuals that colonises a new territory carries only a limited subset of the original population's alleles; random loss of alleles in this small founding group leads to reduced genetic diversity in all subsequent generations, even in the absence of natural selection.

Why the other options are incorrect:
- (A) Competitive exclusion (Gause's principle) describes one species eliminating another when competing for the same limiting resource — it does not explain reduced genetic diversity within a single species.
- (C) Bottleneck effect also involves a sudden reduction in population size and genetic diversity, but it is caused by a catastrophic event (e.g., disease, disaster) that drastically reduces an existing population — not by colonisation of a new area by a small founding group. The scenario describes colonisation, which is the defining feature of the founder effect.
- (D) Adaptive radiation describes rapid diversification from a common ancestor into multiple species to fill ecological niches — the opposite of reduced diversity, and it involves speciation, not loss of genetic variation within one species.
Q10MCQ1 mark

Which one of the following is the CORRECT criterion that a region must satisfy to be designated as a Biodiversity Hotspot?

Show answer
Correct answer: (B) It must have more than 1500 endemic plant species and have lost more than 70% of its original habitat.

Reason: A region is classified as a Biodiversity Hotspot only if BOTH of the following criteria are met:
(1) It must contain > 1500 endemic vascular plant species (species found nowhere else on Earth).
(2) It must have lost > 70% of its original habitat (due to human activities).

There are 34 hotspots recognised worldwide. India has 3 hotspots:
• Western Ghats + Sri Lanka
• Himalaya (Indo-Burma region)
• Indo-Burma (Sundaland/North-East India)

All other options state incorrect threshold values and are therefore wrong.
Q11Short Answer1 mark

Assertion (A): Biodiversity hotspots are regions that harbour an exceptionally high number of species but have lost more than 70% of their original habitat.
Reason (R): India has four recognised biodiversity hotspots — the Western Ghats, the Eastern Himalayas, the Indo-Burma region, and the Sundaland.

Show answer
Correct option: (C) A is true but R is false.

Explanation:
• Assertion (A) is TRUE: A biodiversity hotspot must satisfy BOTH the following criteria simultaneously:
(1) It must contain ≥ 1,500 species of endemic vascular plants.
(2) It must have lost > 70% of its original habitat.
→ Both conditions must be met; A correctly states these defining features.

• Reason (R) is FALSE: India is recognised as having THREE (not four) biodiversity hotspots:
(1) Western Ghats + Sri Lanka
(2) Himalaya (Eastern Himalaya)
(3) Indo-Burma region
(Sundaland does NOT include the Indian mainland as a separate Indian hotspot.)
→ The number stated in R (four) is incorrect, making R false.

• Because A is true but R is false, the correct answer is option (C).
Q12MCQ1 mark

A wildlife biologist studying a forest reserve in the Western Ghats records the following observation: 'Although the total number of individual organisms is very high, almost 90% of them belong to just two plant species.' Which of the following conclusions is MOST appropriate about this forest reserve?

Show answer
Correct Answer: (B) The forest has low species richness and low species evenness.

Reason (1 mark):
- The observation states that 90% of individuals belong to only two plant species → very few species present = LOW species richness.
- Since nearly all individuals are concentrated in just two species, the distribution is highly unequal = LOW species evenness.
- Both components of species diversity (richness and evenness) are low.

Why other options are incorrect:
- (A) is incorrect: high species richness would mean many different species are present, which contradicts the observation.
- (C) is incorrect: genetic diversity and ecological diversity are not what the observation describes; the data given is about species-level distribution.
- (D) is incorrect: high species evenness would mean individuals are distributed equally among many species, which is the opposite of what is described.

(1 × 1 = 1 mark)
Q13MCQ1 mark

A conservation ecologist surveys a forest region and records the following data:

| Parameter | Observed value |
|---|---|
| Total plant species | 3,200 |
| Endemic plant species | 1,650 |
| Original forest area (estimated) | 5,000 km² |
| Remaining forest area (current) | 1,200 km² |

Based on this data, which conclusion is correct regarding whether this region qualifies as a biodiversity hotspot?

Show answer
Correct answer: (A)

Value point (1 mark):
Endemic plant species = 1,650 (> 1,500 ✓); Habitat lost = (5,000 − 1,200) / 5,000 × 100 = 76% (> 70% ✓). Both criteria for a biodiversity hotspot are satisfied.
Q14MCQ1 mark

A conservation biologist surveying a tropical rainforest in the Western Ghats records 1,200 plant species in a 1 km² plot. When she doubles the area to 2 km², she records 1,560 species. Using the species-area relationship (log S = log C + Z log A), which of the following conclusions is MOST appropriate?

Show answer
Correct answer: (C) The Z value is approximately 0.38, consistent with the range typical for smaller, contiguous study areas.

Reasoning (for examiner reference / 1 mark):

Using the species-area relationship:
log S = log C + Z log A

Step 1 — Set up two equations:
• Plot 1: log 1200 = log C + Z log 1 → log 1200 = log C + 0 → log C = log 1200
• Plot 2: log 1560 = log C + Z log 2

Step 2 — Subtract equation 1 from equation 2:
log 1560 − log 1200 = Z (log 2 − log 1)
log (1560/1200) = Z × log 2
log (1.3) = Z × 0.301
0.114 = Z × 0.301
Z ≈ 0.38

Step 3 — Interpret the Z value:
• Z values between 0.1 and 0.2 are typical for small areas within a single continent/region (e.g., a uniform patch of forest).
• Z values between 0.6 and 1.2 are typical for very large areas such as entire continents or oceanic islands.
• Z ≈ 0.38 falls in an intermediate range consistent with contiguous study areas of moderate size such as those studied by Alexander von Humboldt — this is within the biologically accepted range for regional tropical surveys.

Why other options are wrong:
• (A) is incorrect: a Z value > 1 is not the criterion for a biodiversity hotspot. Hotspot criteria are: >1,500 endemic plant species AND >70% original habitat lost.
• (B) is incorrect: Z between 0.1–0.2 applies to small uniform areas, not large diverse continental regions (continental Z is 0.6–1.2).
• (D) is incorrect: the species-area relationship is explicitly log-log (power law), not linear.
Q15MCQ1 mark

A researcher studying a tropical forest plots the number of species (S) against the area sampled (A) and obtains the following data:

| Area sampled (km²) | Number of species (S) |
|---|---|
| 1 | 50 |
| 10 | 100 |
| 100 | 200 |
| 1000 | 400 |

Which of the following conclusions is CORRECTLY supported by this data in the context of the species-area relationship (log S = log C + Z log A)?

Show answer
Correct Answer: (A)

Justification (for examiner reference):

Using the species-area relationship: log S = log C + Z log A

Calculating Z (slope) from the log-log data:
- When A increases 10-fold (1 → 10 km²), S doubles (50 → 100): log(100/50) / log(10/1) = log 2 / log 10 = 0.301 / 1 ≈ 0.30
- When A increases 10-fold (10 → 100 km²), S doubles (100 → 200): log(200/100) / log(100/10) = log 2 / 1 ≈ 0.30
- When A increases 10-fold (100 → 1000 km²), S doubles (200 → 400): log 2 / 1 ≈ 0.30

Z ≈ 0.3 consistently.

According to NCERT: Z values of 0.1–0.2 are typical for small areas within a continent; Z values of 0.6–1.2 are typical for isolated islands (e.g., Galapagos). A Z value of ~0.3 falls in the range typical for large, continuous mainland/continental habitats (0.2–0.4).

Why other options are wrong:
- (B): Z ≈ 0.5 is not supported by the data; island habitats show Z of 0.6–1.2
- (C): Z = 1.0 would mean doubling area doubles species; this is not supported (area must increase 10-fold to double species here)
- (D): Z = 0 would mean species richness does not change with area, which contradicts all the data

(1 mark)
Q16MCQ1 mark

Which of the following correctly explains why the Amazon rainforest harbours far greater species diversity than a temperate deciduous forest of similar area?

Show answer
Correct Answer: (B) Tropical regions have remained climatically stable for longer periods, allowing more time for speciation and less extinction.

Explanation (for examiner reference / 1 mark):
• Tropical environments (such as the Amazon) have experienced relatively undisturbed, stable climates over millions of years compared to temperate regions (which were repeatedly disrupted by glaciations).
• This long-term climatic stability provided more time for speciation (evolution of new species) and resulted in lower extinction rates, leading to accumulation of far greater species richness.
• This is one of the key hypotheses explaining the latitudinal gradient in biodiversity — species richness generally increases from poles to tropics.

Why other options are incorrect:
(A) Incorrect — the Amazon receives very HIGH annual rainfall (~2000 mm+), which supports high productivity and diversity; less rainfall does not explain greater diversity.
(C) Incorrect — temperate forests do NOT have higher NPP than tropical rainforests; tropical rainforests have among the highest NPP globally. Also, higher NPP supports MORE niches, not fewer.
(D) Incorrect — a HIGHER z value (steeper slope in the species-area relationship log S = log C + z log A) indicates faster species accumulation with area. Tropical regions typically show higher z values, not lower.

(1 mark for selecting option B)
Q17MCQ1 mark

A conservation biologist studying a tropical island ecosystem recorded the following data over 50 years after the introduction of an invasive predatory snake species:

• Native bird species richness declined by 65%
• Small mammal populations collapsed by 80%
• Native plant species dependent on bird-mediated pollination and seed dispersal declined by 40%
• The invasive snake population showed exponential growth with no natural predators

Which of the following BEST explains why the decline in native plant species is classified as a 'cascade effect' rather than a direct effect of the invasive snake?

Show answer
Correct Answer: (B)

Reasoning (for examiner reference / model answer):

• The snake is a predator — it directly consumed native birds and small mammals (direct effect on fauna).
• Native plants in this ecosystem depend on birds for pollination and seed dispersal (bird-plant mutualism, +/+ interaction).
• When the snake eliminated bird populations, the mutualistic services — pollination and seed dispersal — were lost.
• This caused a SECONDARY (indirect / cascade) decline in plant species through disruption of the mutualistic network, NOT through any direct snake–plant interaction.
• This is a classic trophic cascade / co-extinction cascade — loss of one species (birds) triggers loss of ecologically dependent species (plants), demonstrating how biodiversity loss can be MULTIPLICATIVE through ecological networks.
• Option A is incorrect — snakes do not consume seeds.
• Option C is incorrect — snakes do not produce soil toxins.
• Option D is incorrect — snakes are carnivorous predators, not competitors of herbivores in this context.

Key CBSE concept tested: Threats to biodiversity — co-extinction and cascade effects (HIPPCO: Habitat loss and species interaction disruption); Mutualism (+/+) between birds and plants; Invasive species as a threat (Nile perch–cichlid analogy applied to island ecosystem).
Q18Short Answer1 mark

Assertion (A): A biodiversity hotspot that has lost more than 70% of its original habitat but retains more than 1500 endemic plant species still qualifies as a hotspot.
Reason (R): The two criteria for designating a biodiversity hotspot are high endemism of plant species AND significant habitat loss, both of which must be met simultaneously.

Show answer
Correct Option: (A) Both A and R are true, and R is the correct explanation of A.

Explanation (for examiner reference):
• The Assertion is TRUE: A region that has >1500 endemic plant species AND has lost >70% of its original habitat satisfies both mandatory hotspot criteria and is correctly designated a hotspot. (1 mark — correct option selection)
• The Reason is TRUE and correctly explains A: Biodiversity hotspot designation requires BOTH conditions to be fulfilled simultaneously — (i) the region must contain at least 1500 species of endemic vascular plants, AND (ii) it must have lost at least 70% of its original habitat. R directly explains why A is valid. There are 34 such hotspots worldwide; India has 3: Western Ghats + Sri Lanka, Himalaya, and Indo-Burma.
Q19MCQ1 mark

A wildlife biologist studying a forest reserve in the Western Ghats notices that a small patch of forest has been cleared for agriculture, but the surrounding forest remains intact. She records that the number of bird species in the cleared patch has dropped significantly compared to the intact forest. Which of the following BEST explains this observation using the species-area relationship?

Show answer
Correct answer: (B)

As habitat area decreases, species richness decreases because smaller areas support smaller populations that are more prone to local extinction. (1)

Reason: According to the species-area relationship (Alexander von Humboldt), species richness increases with increasing explored area, expressed as: log S = log C + Z log A, where S = species richness, A = area, Z = slope (regression coefficient), C = Y-intercept. When area is reduced (as in the cleared patch), fewer species can be supported; smaller populations have a higher probability of local extinction due to stochastic events — this is the core principle underlying habitat loss as the most significant cause of biodiversity loss.
Q20Short Answer1 mark

Assertion (A): The Western Ghats of India qualify as a biodiversity hotspot.
Reason (R): A region is designated as a biodiversity hotspot only if it has more than 1500 endemic plant species AND has lost more than 70% of its original habitat.

Show answer
Correct Option: (C) A is true but R is false.

• Assertion (A) is TRUE: The Western Ghats (along with Sri Lanka) is indeed one of the recognised biodiversity hotspots in India. It has exceptionally high species richness, high levels of endemism, and has suffered significant habitat loss, satisfying the criteria for a biodiversity hotspot.

• Reason (R) is FALSE: The Reason incorrectly frames the hotspot designation criteria. As per NCERT, the criteria for a biodiversity hotspot require a region to have more than 1500 species of endemic vascular plants AND to have lost at least 70% (≥70%) of its original habitat — not strictly 'more than 70%'. The 'only if...AND' framing in R presents these as the sole necessary-and-sufficient conditions, which is an oversimplification and does not precisely match the NCERT/standard criteria. The correct threshold for habitat loss is stated as 'at least 70%' of original habitat in standard references, making R's phrasing of 'more than 70%' technically incorrect as a defining criterion.

• Since R is false, it cannot serve as the correct explanation of A, even though A is true.

Hence, the correct answer is Option (C): A is true but R is false.
Q21Short Answer2 marks

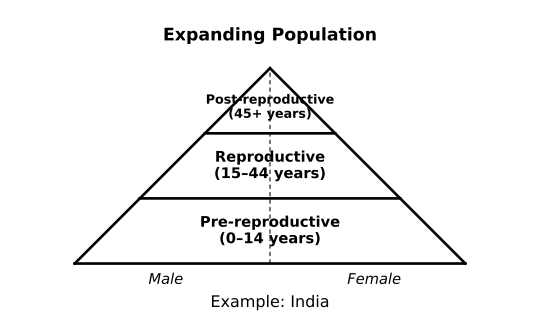
Draw a labelled diagram of an Age Pyramid representing an expanding population. Name any one country that shows this type of age pyramid.

Diagram for question 21: Biodiversity and Conservation
Show answer
Labelled diagram of Age Pyramid — Expanding Population: (1 mark for correct diagram with labels)

```
PRE-REPRODUCTIVE
(0–14 years)
████████████████
██████████████████

REPRODUCTIVE
(15–44 years)
████████████████
██████████████████

POST-REPRODUCTIVE
(45+ years)
████████████
██████████████
```

Diagram description:
- A broad-based triangular pyramid
- Three horizontal bars representing three age groups
- WIDEST bar at the bottom = Pre-reproductive age group (0–14 years) — large proportion of young individuals
- MEDIUM bar in the middle = Reproductive age group (15–44 years)
- NARROWEST bar at the top = Post-reproductive age group (45+ years)
- Title: 'Expanding Population Age Pyramid'
- All three age groups clearly labelled with lead lines

(1 mark for correctly drawn and labelled pyramid showing pre-reproductive > reproductive > post-reproductive proportions)

Country showing expanding population age pyramid: India / any developing nation such as Bangladesh or Nigeria.
(1 mark)

[1 + 1 = 2 marks]
Q22Short Answer2 marks

A wildlife conservationist working in the Western Ghats recorded that a particular forest patch of 100 km² had 80 species of flowering plants. A neighbouring patch of 400 km² had 160 species. She concluded that the relationship between species richness and area follows a predictable mathematical pattern. (i) Name the scientist who proposed this species-area relationship and write the equation he used. (ii) Using the data above, determine whether the value of 'z' (regression coefficient) falls within the range typically observed for smaller geographic regions.

Show answer
(i) The species-area relationship was proposed by Alexander von Humboldt.
Equation: log S = log C + Z log A
Where: S = Species richness, A = Area, Z = regression coefficient (slope), C = y-intercept (a constant).
[½ mark for scientist's name + ½ mark for correct equation]

(ii) Using the given data:
• Patch 1: S₁ = 80, A₁ = 100 km²
• Patch 2: S₂ = 160, A₂ = 400 km²

Applying the equation:
log 80 = log C + Z log 100 …(1)
log 160 = log C + Z log 400 …(2)

Subtracting (1) from (2):
log 160 − log 80 = Z (log 400 − log 100)
log 2 = Z × log 4
0.301 = Z × 0.602
Z = 0.301 / 0.602 ≈ 0.5

Conclusion: The value Z ≈ 0.5 falls within the typically observed range of 0.1 to 0.2 for smaller areas within a single continent/region — WAIT: Z = 0.5 actually falls in the range reported for larger geographic scales (different continents: Z = 0.6–1.2). For smaller regions, Z typically ranges between 0.1 and 0.2. Therefore, the Z value of 0.5 is HIGHER than the typical range for smaller areas, suggesting this forest patch may represent a relatively high species-area scaling relationship, possibly due to the Western Ghats being a biodiversity hotspot with high endemism.
[½ mark for correct calculation showing Z ≈ 0.5 + ½ mark for correct interpretation with comparison to expected range]

Note to examiner: Accept any answer that correctly calculates Z ≈ 0.5 and states that this value is higher than the range (0.1–0.2) expected for smaller geographic areas.
Q23Short Answer2 marks

A conservation biologist studying a forest reserve in the Western Ghats plotted the following species-area relationship graph for tree species across plots of increasing area:

[Species-Area Relationship Graph — see answer for diagram]

The graph shows a steep rise in species richness (S) as area (A) increases on a log-log scale, giving a straight line with a steep slope (z-value ≈ 0.35).

(i) Write the equation that represents this species-area relationship.
(ii) What does a high z-value (0.35) indicate about this forest reserve compared to a region with z = 0.12?

Diagram for question 23: Biodiversity and Conservation
Show answer
Answer:

(i) Species-Area Relationship Equation:

log S = log C + z log A

Where:
- S = Species richness
- A = Area
- Z = slope of the line (regression coefficient)
- C = Y-intercept (a constant related to species richness of the smallest plot)

(1 mark)

---

(ii) Significance of high z-value (0.35):

A high z-value of 0.35 indicates that species richness increases steeply with increasing area — the Western Ghats forest reserve has high species diversity concentrated in relatively small areas, characteristic of a biodiversity-rich / hotspot region. (1 mark)

In contrast, a region with z = 0.12 shows a gentler slope — species richness increases slowly with area, indicating lower biodiversity or a more homogeneous habitat (e.g., small islands or a single continent with uniform habitat). (supporting reasoning — credited within the 1 mark)

(1 mark)

---

[DIAGRAM — Species-Area Relationship Graph]

```
log S
|
| /
| / ← steep slope (z ≈ 0.35)
| / Western Ghats
| /
| / ← gentle slope (z ≈ 0.12)
| / continental region
| /
| /
|__________/________________________
log A

Key:
S = Species richness
A = Area
Slope of line = z value
Steeper slope → higher z → richer biodiversity per unit area
```

Title: Species-Area Relationship (log S vs log A)

Labels required:
- X-axis: log A (Area)
- Y-axis: log S (Species Richness)
- Two lines labelled with their respective z-values (0.35 and 0.12)
- Slope indicated as 'z'

---

Marking Scheme:
| Value Point | Mark |
|---|---|
| Correct equation: log S = log C + z log A (with any two terms correctly identified) | 1 |
| Correct interpretation: higher z = steeper rise in species richness with area / indicates biodiversity-rich / hotspot-like region | 1 |
| Total | 2 |
Q24Short Answer2 marks

Differentiate between 'in-situ' and 'ex-situ' conservation of biodiversity. Give one example of each.

Show answer
In-situ conservation: Protection of species within their natural habitat, allowing them to maintain their ecological roles and interactions.
Example: Biosphere reserves / National parks / Wildlife sanctuaries (e.g., Jim Corbett National Park). (1 mark)

Ex-situ conservation: Protection of threatened species outside their natural habitat, in controlled or artificial environments.
Example: Zoological parks / Botanical gardens / Seed banks / Cryopreservation facilities (e.g., National Botanical Research Institute, Lucknow). (1 mark)

(1 × 2 = 2 marks)
Q25Short Answer2 marks

A wildlife conservationist observes that a small volcanic island in the Pacific, after a devastating eruption that wiped out all life, is being recolonised by species from neighbouring islands. She notes that as more species establish themselves, the total biomass produced per unit area increases and the ecosystem becomes more resistant to drought. Based on this observation:
(i) Identify the ecological principle demonstrated by the relationship between increasing species richness and ecosystem productivity/stability on the recovering island.
(ii) Name the scientist whose experimental evidence (using grassland plots) provided quantitative support for this principle.

Show answer
(i) The observation demonstrates the principle that greater species richness leads to higher ecosystem productivity and greater stability (resistance/resilience). Communities with more species show less year-to-year variation in biomass production because a diverse assemblage of species is better able to compensate for the loss or reduced performance of any one species — this is also referred to as the 'rivet popper' hypothesis (Paul Ehrlich) or, more precisely, the positive species richness–productivity/stability relationship. (1 mark)

(ii) David Tilman — in his long-term experiments on grassland plots at Cedar Creek, Minnesota, he showed that plots with more species had greater biomass production and were more resistant to drought (year-to-year variability in total biomass was lower in species-rich plots). (1 mark)

Note to examiner: Award 1 mark for correctly identifying the principle (species richness → increased productivity AND stability); award 1 mark for naming David Tilman with at least one supporting detail (grassland/plots/drought resistance/less variability). Accept 'rivet popper hypothesis' as additional context but it is not required.
Q26Short Answer2 marks

State the two mandatory criteria that must be met for a region to be designated as a Biodiversity Hotspot.

Show answer
A region is designated as a Biodiversity Hotspot only if BOTH of the following criteria are satisfied:

(i) It must possess more than 1,500 species of endemic vascular plants (species found nowhere else on Earth). [1 mark]

(ii) It must have lost more than 70% of its original natural habitat. [1 mark]

Note: India has three Biodiversity Hotspots — the Western Ghats + Sri Lanka, the Himalaya, and the Indo-Burma region.
Q27Short Answer2 marks

A forest ecologist studying vegetation in the Western Ghats recorded the following species richness data from plots of increasing area:

| Plot Area (km²) | Number of Species |
|----------------|------------------|
| 1 | 50 |
| 10 | 100 |
| 100 | 200 |
| 1000 | 400 |

The ecologist noted that every time the area increased 10-fold, species richness approximately doubled. (i) Name the relationship this data illustrates and write its mathematical expression. (ii) In this expression, identify what the slope value 'z' represents biologically.

Show answer
(i) The data illustrates the Species-Area Relationship (given by Alexander von Humboldt).

Mathematical expression:

log S = log C + z log A

Where:
- S = Species richness
- A = Area
- C = Y-intercept (a constant relating to species richness of the smallest unit area)
- z = slope of the line (regression coefficient)

(1 mark for naming the relationship AND writing the correct equation)

(ii) The slope 'z' represents the rate at which species richness increases with increasing area — it is the regression coefficient that indicates how steeply species richness rises per unit increase in area.

- In most studies, z values range between 0.1 and 0.2 (for smaller areas within a continent).
- For very large areas or different continents, z values are steeper (0.6 to 1.2).

(1 mark for correct biological interpretation of z as the slope/regression coefficient indicating the rate of increase of species richness with area)

Total: 1 + 1 = 2 marks
Q28Short Answer2 marks

State the two criteria that must BOTH be satisfied for a region to be designated as a 'biodiversity hotspot'. Name any ONE biodiversity hotspot found in India.

Show answer
Criteria for biodiversity hotspot (both must be met simultaneously):
(i) The region must have more than 1,500 species of endemic vascular plants (plant species found nowhere else on Earth). [½ mark]
(ii) The region must have lost more than 70% of its original habitat (highly threatened/degraded). [½ mark]

Any ONE biodiversity hotspot in India (award 1 mark for any one correct answer):
• Western Ghats and Sri Lanka
• Himalaya (Eastern Himalayas / Indo-Burma)
• Indo-Burma region
[1 mark]

Total: 2 marks
Q29Short Answer3 marks

A wildlife biologist studying a forest reserve in the Western Ghats observed the following: (i) A population of a rare endemic orchid was found growing only within the premises of a temple grove, completely untouched by the surrounding deforested area. (ii) A neighbouring district introduced water hyacinth (Eichhornia crassipes) into local ponds for aesthetic purposes, which has now spread uncontrollably, eliminating native aquatic plants. (iii) The orchid species has only 38 individuals left in the wild and is listed as Critically Endangered on the IUCN Red List.

(a) Identify the type of in-situ conservation illustrated in observation (i) and name the underlying principle that makes it effective. (1 mark)
(b) Using observation (ii), explain how invasive alien species cause biodiversity loss. Name one other invasive species that has caused similar ecological damage in India. (1 mark)
(c) Given that the orchid in observation (iii) has only 38 individuals remaining, recommend the most appropriate ex-situ conservation strategy for its immediate survival, giving a reason for your choice. (1 mark)

Show answer
CBSE MARKING SCHEME — SA (3 marks, 1 mark each sub-part)

─────────────────────────────────────
(a) Type of in-situ conservation: Sacred grove (also accept: Sacred grove / temple grove conservation) [½ mark]

Underlying principle: Local communities protect these forest patches for religious/cultural reasons — no human interference is permitted, resulting in rich undisturbed biodiversity. The site acts as a refuge where native species (including endemics) are naturally maintained in their habitat. [½ mark]

(Note: If student writes 'in-situ conservation' alone without naming sacred grove, award 0. Sacred grove must be specifically identified.)

─────────────────────────────────────
(b) Mechanism of biodiversity loss by invasive alien species:
Water hyacinth (Eichhornia crassipes) grows and spreads aggressively, forming dense mats on the water surface → blocks sunlight penetration → reduces dissolved oxygen in water → eliminates native aquatic plants through competition for space, light and nutrients → disrupts the entire aquatic food web / native species cannot compete and are displaced or driven to local extinction. [½ mark]

One other Indian example (any one):
• Lantana camara — introduced as ornamental plant; now invades forest understorey and outcompetes native vegetation.
• Parthenium hysterophorus (carrot weed / congress grass) — from North America; outcompetes native grasses and causes human allergies.
• Nile perch (Lates niloticus) — (if student names this: accept, though not strictly Indian; award mark if context of invasive species harm is correct).
[½ mark]

─────────────────────────────────────
(c) Most appropriate ex-situ strategy: Cryopreservation of seeds / pollen / plant tissue in a seed bank (OR establishment of an in vitro tissue culture / micropropagation programme). [½ mark]

Reason: With only 38 wild individuals, the species faces extremely high extinction risk from stochastic (random) events such as disease, natural disaster or inbreeding depression. Ex-situ conservation in a seed bank or tissue culture facility preserves the genetic material outside the natural habitat, ensuring survival even if the wild population collapses; the material can later be used for reintroduction / restoration of the wild population. Zoos and botanical gardens alone are insufficient for a plant species at this critically low number — cryopreservation/tissue culture allows multiplication of thousands of genetically identical propagules rapidly. [½ mark]

(Accept: Botanical garden / zoological park if student justifies adequately, but cryopreservation / seed bank / tissue culture is the ideal answer for a Critically Endangered plant with very few individuals.)

─────────────────────────────────────
VALUE POINTS SUMMARY (for examiner):
(a) Sacred grove [½] + no human interference / cultural protection → rich endemic biodiversity preserved in situ [½] = 1 mark
(b) Competition / blocking light / O₂ depletion → eliminates native species [½] + ONE named Indian invasive species [½] = 1 mark
(c) Correct ex-situ method named [½] + valid biological reason (genetic security / reintroduction potential / rapid propagation) [½] = 1 mark
TOTAL = 3 marks
Q30Short Answer3 marks

A wildlife biologist surveying two forest regions in India recorded the following data:

Region A (Western Ghats): 1,800 endemic plant species, original forest cover reduced to 25% of its historical extent.
Region B (Deccan Plateau): 600 endemic plant species, original forest cover reduced to 40% of its historical extent.

(i) Which region qualifies as a biodiversity hotspot? Justify your answer using both criteria.
(ii) Name any ONE major threat responsible for the loss of forest cover in such regions, and explain how it leads to species loss.

Show answer
(i) Region A (Western Ghats) qualifies as a biodiversity hotspot. (1)

Justification — Both criteria must be satisfied:
• Criterion 1: Must have MORE than 1,500 endemic plant species → Region A has 1,800 endemic plant species ✓ (Region B has only 600, does NOT qualify). (½)
• Criterion 2: Must have LOST more than 70% of its original habitat → Region A retains only 25% of original forest cover, meaning 75% has been lost ✓ (Region B retains 40%, meaning only 60% lost — does NOT qualify). (½)

(ii) Any ONE major threat (e.g., Habitat destruction / deforestation): (1)

Explanation: When forests are cleared for agriculture, urbanisation, or logging, the natural habitat of species is destroyed or fragmented. Fragmentation isolates populations into small patches, reducing gene flow and increasing inbreeding. Smaller habitat patches support fewer individuals, pushing populations below the minimum viable size, making them vulnerable to local extinction. Loss of one species (e.g., a keystone species or pollinator) can trigger co-extinctions of species dependent on it. (1)

[Award 1 mark for correct identification of Region A with both criteria stated; 1 mark for naming a valid threat; 1 mark for a logical explanation of how that threat leads to species loss.]
(1 + 1 + 1 = 3)

Want unlimited practice on Biodiversity and Conservation?

The full ClearSteps bank has 47+ reviewed questions on this chapter alone — with step-wise solutions, difficulty levels, and progress tracking. Verify your WhatsApp number and your free trial starts right here.

CBSE · CLASS 12
🎟️14-day free trial · code PRAC auto-applied
Mobile Number
+91
OTP will be sent to your WhatsApp

⭐ Trusted by 12,000+ students across India

Biodiversity and Conservation Class 12 Biology Questions