ClearStepsCLEARSTEPS AI
Teacher Login →Student Login →

Ecosystem: Class 12 Biology Practice Questions

23 original exam-pattern questions with full answers, matched to the current CBSE Class 12 paper design, including case-based questions. Attempt each question before opening the answer — or start a free 14-day trial ↓ for the full bank.

Q1Case-based4 marks

A team of ecologists studied two ecosystems — a dense tropical rainforest (Ecosystem A) and an open ocean (Ecosystem B). In Ecosystem A, they measured the total organic matter produced by all the autotrophs in one year and found it to be 800 g m⁻² yr⁻¹. Of this, the plants used 200 g m⁻² yr⁻¹ for their own metabolic activities. In Ecosystem B, the standing crop biomass of producers (phytoplankton) was found to be much less than that of the consumers (zooplankton), yet the ecosystem was thriving with high productivity. The ecologists also noted that dead leaves, fallen logs, and animal dung in Ecosystem A were being rapidly broken down by a community of organisms, releasing inorganic nutrients back into the soil.

Read the following passage carefully and answer the questions that follow:

A team of ecologists studied two ecosystems — a dense tropical rainforest (Ecosystem A) and an open ocean (Ecosystem B). In Ecosystem A, they measured the total organic matter produced by all the autotrophs in one year and found it to be 800 g m⁻² yr⁻¹. Of this, the plants used 200 g m⁻² yr⁻¹ for their own metabolic activities. In Ecosystem B, the standing crop biomass of producers (phytoplankton) was found to be much less than that of the consumers (zooplankton), yet the ecosystem was thriving with high productivity. The ecologists also noted that dead leaves, fallen logs, and animal dung in Ecosystem A were being rapidly broken down by a community of organisms, releasing inorganic nutrients back into the soil.

(a) Calculate the Net Primary Productivity (NPP) of Ecosystem A. Name the process by which plants use the 200 g m⁻² yr⁻¹ mentioned above. (1 mark)
(b) The pyramid of biomass in Ecosystem B (open ocean) is inverted. Give ONE reason to justify this observation. (1 mark)
(c) Name the community of organisms responsible for breaking down dead organic matter in Ecosystem A. Write any TWO steps of the decomposition process carried out by these organisms. (2 marks)

Show answer
MARKING SCHEME — CASE STUDY (Total: 4 marks)

─────────────────────────────────────────
(a) NPP of Ecosystem A and process name: (1 mark)
─────────────────────────────────────────
• Formula: NPP = GPP − R (plant respiration)
• NPP = 800 − 200 = 600 g m⁻² yr⁻¹ [½ mark]
• The process by which plants use 200 g m⁻² yr⁻¹ is: Respiration (plant/autotrophic respiration) [½ mark]

─────────────────────────────────────────
(b) Reason for inverted pyramid of biomass in open ocean: (1 mark)
─────────────────────────────────────────
• In the open ocean, the producers are phytoplankton which have a very short life span and a very rapid rate of reproduction/turnover. [½ mark]
• At any given moment, the standing crop (biomass) of phytoplankton is small, but it supports a much larger biomass of zooplankton (consumers) because phytoplankton are consumed almost as fast as they are produced — hence the pyramid of biomass is inverted. [½ mark]
(Award full 1 mark for one complete, justified reason.)

─────────────────────────────────────────
(c) Community of organisms + TWO steps of decomposition: (2 marks)
─────────────────────────────────────────
• The community of organisms responsible for breaking down dead organic matter is called Decomposers / Detritivores (e.g., bacteria, fungi — also called saprotrophs / reducers). [1 mark]

• Any TWO of the following steps of decomposition (1 mark each, any 2 = 1 mark total for this part — award ½ mark per correct step):

Step 1 — Fragmentation: Breaking down of detritus (dead organic matter) into smaller particles by detritivores (e.g., earthworms). [½ mark]

Step 2 — Leaching: Water-soluble inorganic nutrients percolate/leach down into the soil and get precipitated as unavailable salts. [½ mark]

Step 3 — Catabolism: Bacterial and fungal enzymes degrade detritus biochemically into simpler inorganic substances. [½ mark]

Step 4 — Humification: Accumulation of a dark-coloured amorphous substance called humus; it is highly resistant to microbial action and serves as a reservoir of nutrients. [½ mark]

Step 5 — Mineralisation: Humus is further degraded by microbes to release inorganic nutrients (e.g., CO₂, water, inorganic salts) into the soil. [½ mark]

(Award any TWO steps correctly named and described: ½ + ½ = 1 mark)

─────────────────────────────────────────
MARK SUMMARY
─────────────────────────────────────────
(a) NPP value + process name = 1 mark
(b) Reason for inverted biomass pyramid = 1 mark
(c) Name of decomposers + any 2 steps = 2 marks
TOTAL = 4 marks
Q2Case-based4 marks

A team of ecologists studied two forest ecosystems — Forest A (a tropical rainforest) and Forest B (a coniferous/boreal forest). They measured the rate of decomposition of leaf litter in both forests over one year. In Forest A, leaf litter disappeared almost completely within 4–6 weeks, whereas in Forest B, thick layers of undecomposed litter (humus) accumulated over several years. The ecologists also measured Gross Primary Productivity (GPP) and the amount of organic matter available to herbivores in both forests.

Forest A: GPP = 2,000 g C m⁻² yr⁻¹; Plant respiration (R) = 900 g C m⁻² yr⁻¹
Forest B: GPP = 800 g C m⁻² yr⁻¹; Plant respiration (R) = 200 g C m⁻² yr⁻¹

Read the following passage carefully and answer the questions that follow:

A team of ecologists studied two forest ecosystems — Forest A (a tropical rainforest) and Forest B (a coniferous/boreal forest). They measured the rate of decomposition of leaf litter in both forests over one year. In Forest A, leaf litter disappeared almost completely within 4–6 weeks, whereas in Forest B, thick layers of undecomposed litter (humus) accumulated over several years. The ecologists also measured Gross Primary Productivity (GPP) and the amount of organic matter available to herbivores in both forests.

Forest A: GPP = 2,000 g C m⁻² yr⁻¹; Plant respiration (R) = 900 g C m⁻² yr⁻¹
Forest B: GPP = 800 g C m⁻² yr⁻¹; Plant respiration (R) = 200 g C m⁻² yr⁻¹

(a) Calculate the Net Primary Productivity (NPP) of both Forest A and Forest B. Which forest has more organic matter available for consumers? Show your working. (1 mark)

(b) Give TWO reasons, based on abiotic factors, why decomposition is much faster in Forest A than in Forest B. (1 mark)

(c) In Forest B, the accumulated leaf litter represents an enormous store of organic carbon. A forest fire burns through Forest B completely. Explain the immediate impact of this event on: (i) the carbon cycle, and (ii) the nutrient availability in the soil. (2 marks)

Show answer
MARKING SCHEME — 4 marks

─────────────────────────────────────────
(a) NPP Calculation [1 mark]
─────────────────────────────────────────
Formula: NPP = GPP − R

• Forest A: NPP = 2,000 − 900 = 1,100 g C m⁻² yr⁻¹
• Forest B: NPP = 800 − 200 = 600 g C m⁻² yr⁻¹

Conclusion: Forest A has more organic matter available for consumers, since its NPP (1,100 g C m⁻² yr⁻¹) is greater than that of Forest B (600 g C m⁻² yr⁻¹).

[Award 1 mark for both correct NPP values AND correct identification of Forest A as having more organic matter available for consumers. Both calculations must be shown.]

─────────────────────────────────────────
(b) Abiotic reasons for faster decomposition in Forest A [1 mark]
─────────────────────────────────────────
Award 1 mark for any TWO correct abiotic factors stated together as a single value point:

1. Higher temperature: Tropical rainforest (Forest A) has consistently high temperatures (~25–30°C) year-round, which increases the enzymatic activity of decomposer microorganisms (bacteria and fungi), thereby accelerating the breakdown of leaf litter.

2. Higher moisture/humidity: Tropical rainforests receive heavy and regular rainfall, resulting in high soil moisture content, which provides optimal conditions for decomposer activity and speeds up decomposition.

(Any other valid abiotic factor such as higher rainfall facilitating physical breakdown and leaching of organic matter is also acceptable.)

[Award 1 mark as a single unit for any two correct abiotic factors linked to decomposer activity or physical breakdown. 'More decomposer organisms' is a biotic factor — do NOT award the mark for this alone. Do NOT split as ½ + ½; the full 1 mark is awarded when two correct abiotic factors are identified.]

─────────────────────────────────────────
(c) Impact of forest fire in Forest B [2 marks]
─────────────────────────────────────────

(i) Impact on the Carbon Cycle [1 mark]

The accumulated leaf litter and organic matter (representing a large terrestrial carbon store) undergo rapid combustion during the fire, resulting in the sudden and massive release of carbon dioxide (CO₂) — and smaller amounts of carbon monoxide (CO) — directly into the atmosphere. This represents an abrupt transfer of carbon from the terrestrial/soil carbon pool to the atmospheric carbon pool, significantly increasing atmospheric CO₂ concentration and contributing to the greenhouse effect/global warming. The long-term carbon sink function of the forest is destroyed, and what had been stored over many years is released almost instantaneously.

[Award 1 mark for: combustion of accumulated organic matter/leaf litter → sudden/massive release of CO₂ into the atmosphere → increase in atmospheric carbon / disruption of carbon cycle. Any equivalent correct explanation accepted.]

(ii) Impact on Nutrient Availability in the Soil [1 mark]

The burning of the accumulated leaf litter and organic matter produces ash, which contains inorganic mineral nutrients such as phosphates, potassium (potash), calcium, and nitrates. These inorganic minerals are released directly into the soil from the ash, causing an immediate and short-term increase in soil nutrient availability. Thus, although the long-term nutrient reservoir stored in the organic litter is destroyed (eliminating the slow, steady release of nutrients through decomposition), the fire initially makes mineral nutrients rapidly available to any surviving or colonising plants in the short term.

[Award 1 mark for: burning releases inorganic mineral nutrients (e.g., phosphates, potassium, nitrates/calcium) from ash into the soil → immediate/short-term increase in soil nutrient availability. Any equivalent correct explanation accepted.]
Q3Case-based4 marks

A group of ecology students visited two different sites for a field study. At Site A — a dense deciduous forest — they observed large trees, shrubs, herbs, and leaf litter on the ground being broken down by fungi and bacteria. They estimated the Gross Primary Productivity (GPP) of the forest to be 180 g dry matter m⁻² year⁻¹ and noted that plants used 60 g dry matter m⁻² year⁻¹ in their own respiration.

At Site B — a shallow freshwater pond — they found abundant phytoplankton, zooplankton, small fish, and a heron. They also noticed that the pond water was becoming increasingly turbid and green due to excessive use of fertilisers on nearby farmland.

Read the following passage carefully and answer the questions that follow:

A group of ecology students visited two different sites for a field study. At Site A — a dense deciduous forest — they observed large trees, shrubs, herbs, and leaf litter on the ground being broken down by fungi and bacteria. They estimated the Gross Primary Productivity (GPP) of the forest to be 180 g dry matter m⁻² year⁻¹ and noted that plants used 60 g dry matter m⁻² year⁻¹ in their own respiration.

At Site B — a shallow freshwater pond — they found abundant phytoplankton, zooplankton, small fish, and a heron. They also noticed that the pond water was becoming increasingly turbid and green due to excessive use of fertilisers on nearby farmland.

(i) Calculate the Net Primary Productivity (NPP) of the deciduous forest at Site A. Show your working. [1 mark]

(ii) At Site A, the students observed a detritus food chain (DFC) operating alongside a grazing food chain (GFC). State which of the two contributes the LARGER fraction of energy flow in this terrestrial ecosystem, and give ONE reason for your answer. [1 mark]

(iii) At Site B, the students noted that the phytoplankton biomass was LESS than the zooplankton biomass at the time of sampling. Name the type of ecological pyramid that would be INVERTED in this situation, and explain why such inversion is possible in aquatic ecosystems. [2 marks]

Show answer
MARKING SCHEME — CASE STUDY (4 marks)

─────────────────────────────────────────
(i) NPP of the deciduous forest [1 mark]
─────────────────────────────────────────
Formula (state before using):
NPP = GPP − R (plant respiration)

Substitution:
NPP = 180 − 60
NPP = 120 g dry matter m⁻² year⁻¹ ✦ [1 mark]

─────────────────────────────────────────
(ii) DFC vs GFC in terrestrial ecosystem [1 mark]
─────────────────────────────────────────
• The DETRITUS FOOD CHAIN (DFC) contributes the LARGER fraction of energy flow in a terrestrial ecosystem such as a deciduous forest. [½ mark]

• Reason: In a terrestrial ecosystem, a large proportion of plant biomass (leaves, wood, roots) dies without being consumed by herbivores and becomes detritus (dead organic matter). Decomposers (fungi and bacteria) process this detritus, so the majority of energy flows through the DFC rather than the GFC. [½ mark]

─────────────────────────────────────────
(iii) Inverted pyramid in the aquatic ecosystem [2 marks]
─────────────────────────────────────────
• The ecological pyramid that is INVERTED in this situation is the PYRAMID OF BIOMASS. [1 mark]

• Explanation of why inversion is possible in aquatic ecosystems:
— In an aquatic ecosystem, phytoplankton (producers) are very small and have an extremely RAPID RATE OF REPRODUCTION (high turnover rate).
— At any given INSTANT of sampling, the standing crop (biomass) of phytoplankton may be LESS than the biomass of zooplankton that they support.
— This is possible because even a small phytoplankton biomass can sustain a larger zooplankton biomass, since phytoplankton are continuously and rapidly replaced.
— Therefore, the pyramid of biomass in an aquatic ecosystem can be INVERTED (spindle-shaped), even though the pyramid of energy always remains upright. [1 mark]

─────────────────────────────────────────
SUMMARY OF MARKS:
(i) NPP calculated correctly with formula shown → 1
(ii) DFC named [½] + valid reason [½] → 1
(iii) Pyramid of biomass named [1] + explanation with turnover/standing crop [1] → 2
TOTAL → 4 marks
─────────────────────────────────────────
Q4Case-based4 marks

A team of ecologists studied energy flow in two contrasting ecosystems — a temperate grassland and an open ocean. In the grassland, producers fixed 1,00,000 J of energy per m² per year. The ecologists measured the energy available at each successive trophic level and recorded the data in the table below.

| Trophic Level | Organism | Energy Available (J m⁻² yr⁻¹) |
|---|---|---|
| T1 — Producers | Grasses | 1,00,000 |
| T2 — Primary Consumers | Grasshoppers | 10,000 |
| T3 — Secondary Consumers | Frogs | 1,000 |
| T4 — Tertiary Consumers | Snakes | 100 |

In the open ocean ecosystem, the ecologists found that the standing crop biomass of phytoplankton (producers) was only 4 g m⁻², while the standing crop biomass of zooplankton (primary consumers) was 11 g m⁻².

Read the following passage and answer the questions that follow.

A team of ecologists studied energy flow in two contrasting ecosystems — a temperate grassland and an open ocean. In the grassland, producers fixed 1,00,000 J of energy per m² per year. The ecologists measured the energy available at each successive trophic level and recorded the data in the table below.

| Trophic Level | Organism | Energy Available (J m⁻² yr⁻¹) |
|---|---|---|
| T1 — Producers | Grasses | 1,00,000 |
| T2 — Primary Consumers | Grasshoppers | 10,000 |
| T3 — Secondary Consumers | Frogs | 1,000 |
| T4 — Tertiary Consumers | Snakes | 100 |

In the open ocean ecosystem, the ecologists found that the standing crop biomass of phytoplankton (producers) was only 4 g m⁻², while the standing crop biomass of zooplankton (primary consumers) was 11 g m⁻².

(a) Using the data from the grassland table, calculate the percentage of energy transferred from T2 to T3. Name the ecological law that this data illustrates. (1 mark)

(b) Draw a pyramid of biomass for the open ocean ecosystem using the data provided. Name this type of pyramid and explain why it has this unusual shape. (2 marks)

(c) The ecologists noted that a large amount of energy fixed at T1 in the grassland never reached T2. Give TWO reasons to account for this energy loss between trophic levels. (1 mark)

Show answer
MARKING SCHEME — Total: 4 marks

─────────────────────────────────────
Part (a) — 1 mark
─────────────────────────────────────
• Percentage energy transferred from T2 → T3:
= (Energy at T3 ÷ Energy at T2) × 100
= (1,000 ÷ 10,000) × 100
= 10% [½ mark for calculation]

• Name of ecological law: Ten Per Cent Law (Lindeman's Ten Per Cent Law / Lindeman's Law of Energy Transfer) [½ mark]

(Award 1 mark for both calculation with correct answer AND name of law; accept 'Lindeman's rule' as equivalent)

─────────────────────────────────────
Part (b) — 2 marks
─────────────────────────────────────
[DIAGRAM — Inverted Pyramid of Biomass for Open Ocean]

Draw and label as follows (pyramid widens DOWNWARD — inverted shape):

```
┌──────────────────────────┐
│ Zooplankton (PC) │ 11 g m⁻²
│ (Primary Consumers) │
└──────────────────────────┘
┌──────────────┐
│ Phytoplankton│ 4 g m⁻²
│ (Producers) │
└──────────────┘

↑ Biomass increases upward (inverted)
```

• Name of this pyramid: Inverted Pyramid of Biomass [½ mark]
• Ecosystem in which it is found: Open ocean / Aquatic (marine) ecosystem [½ mark]
• Explanation of unusual (inverted) shape:
Phytoplankton (producers) have a very small standing crop biomass at any given moment because they reproduce and are consumed extremely rapidly (very high turnover rate). Although their PRODUCTIVITY is high, their biomass measured at a single point in time is lower than the biomass of the zooplankton they support. Therefore the pyramid of biomass appears inverted. [1 mark]

(Award 1 mark for correctly drawn and labelled inverted pyramid + name + ecosystem = 1 mark total for diagram and naming; 1 mark for explanation of rapid turnover/high productivity of phytoplankton)

─────────────────────────────────────
Part (c) — 1 mark
─────────────────────────────────────
Any TWO of the following reasons (½ mark each):

1. A large portion of energy fixed by producers is used in their own RESPIRATION (cellular respiration) and is lost as heat — this energy is not available to the next trophic level. [½ mark]

2. Not all plant biomass is consumed or digestible by primary consumers — dead organic matter, cellulose-rich parts, roots etc. pass to decomposers rather than to T2. [½ mark]

3. Some energy is lost as heat during metabolic processes (second law of thermodynamics — no energy transfer is 100% efficient). [½ mark]

(Award ½ mark each for any two correct reasons; maximum 1 mark)

─────────────────────────────────────
SUMMARY OF VALUE POINTS (4 marks total)
─────────────────────────────────────
(a) 10% calculation + Ten Per Cent Law named = 1 mark (½ + ½)
(b) Inverted pyramid drawn and labelled correctly + named + ecosystem named = 1 mark; Explanation of rapid phytoplankton turnover = 1 mark → total 2 marks
(c) Any two reasons for energy loss between T1 and T2 = 1 mark (½ × 2)
Q5Short Answer1 mark

Assertion (A): The pyramid of biomass in an aquatic ecosystem is inverted, with the biomass of producers being less than that of primary consumers.
Reason (R): Phytoplankton in aquatic ecosystems have a very rapid rate of turnover (reproduction), so their standing crop biomass at any given time appears low despite supporting a larger consumer biomass.

Show answer
Correct option: (A) — Both (A) and (R) are true, and (R) is the correct explanation of (A).

Explanation:
• Assertion is TRUE: In aquatic ecosystems, the pyramid of biomass is INVERTED — the standing crop (biomass) of producers (phytoplankton) is less than the standing crop of primary consumers (zooplankton).
• Reason is TRUE: Phytoplankton reproduce extremely rapidly (very short generation time / high turnover rate). At any single moment, their standing crop biomass is small, yet they continuously produce enough organic matter to support a larger biomass of zooplankton.
• (R) correctly explains (A): The inversion occurs precisely because of the rapid turnover of phytoplankton — their instantaneous biomass underestimates their actual productivity. This is the direct causal reason why the aquatic biomass pyramid is inverted.
• Note: Pyramid of energy is NEVER inverted in any ecosystem, because energy is always lost (~90%) at each trophic level. Only the biomass pyramid (and sometimes numbers pyramid) can be inverted.
Q6MCQ1 mark

Which of the following correctly represents the energy available to secondary consumers if producers fix 1,00,000 J of energy, assuming 10% transfer efficiency at each trophic level?

Show answer
(B) 1,000 J

Explanation (for examiner reference):
Applying the 10% Law (Lindeman, 1942) — only 10% of energy at one trophic level is transferred to the next:
• Producers → 1,00,000 J
• Primary consumers (Trophic Level 2) → 10% of 1,00,000 = 10,000 J
• Secondary consumers (Trophic Level 3) → 10% of 10,000 = 1,000 J

Hence, secondary consumers receive 1,000 J.
Q7MCQ1 mark

In a grassland ecosystem, a researcher measures the following energy values at different trophic levels:

• Grasses (Producers): 1,00,000 J
• Grasshoppers (Primary consumers): 10,000 J
• Frogs (Secondary consumers): 1,000 J
• Snakes (Tertiary consumers): 100 J

The researcher notices that a disease wipes out 80% of the frog population. Which of the following consequences is MOST likely to occur in this ecosystem?

Show answer
Correct answer: (C) Grasshopper populations will increase due to reduced predation, while snake populations will decline due to reduced prey availability.

Reason: The 80% reduction in frog population causes two cascading effects:
(1) Grasshoppers (prey of frogs) face reduced predation pressure → their population INCREASES (trophic cascade — bottom-up effect).
(2) Snakes (predators of frogs) lose their primary prey source → their population DECLINES due to food scarcity.

Why other options are incorrect:
(A) Incorrect — energy available to snakes does NOT increase; energy transfer follows the 10% law and depends on the actual biomass of frogs present. With fewer frogs, snakes receive less energy, not more.
(B) Incorrect — grasshopper population increases (not decreases) because frogs, their predator, have declined.
(D) Incorrect — gross primary productivity (GPP) of grasses is determined by the producers themselves and their abiotic environment (sunlight, CO₂, water), NOT by the number of trophic levels above them.
Q8MCQ1 mark

A limnologist measures the total organic matter present in the phytoplankton (PP) and zooplankton (PC) layers of a pond ecosystem at a single point in time. She finds that the biomass at the PP level is less than the biomass at the PC level. Which of the following correctly explains this observation?

Show answer
Correct answer: (B)

Phytoplankton have a very rapid turnover rate, so standing crop biomass at any instant is low even though productivity is high.

Reason (value point for full credit):
- In aquatic (pond/lake/sea) ecosystems, the producers are microscopic phytoplankton that reproduce extremely rapidly.
- At any given moment, the standing crop biomass of phytoplankton (PP) is small.
- However, their rate of biomass production (productivity) is very high — they are consumed by zooplankton almost as fast as they are produced.
- As a result, the accumulated (standing crop) biomass of zooplankton (PC) can exceed that of phytoplankton at a single point in time.
- This produces an INVERTED pyramid of biomass — a feature unique to aquatic ecosystems.

Why the other options are wrong:
- (A) is incorrect: the inversion is not caused by a comparison of photosynthesis vs. respiration rates in this way.
- (C) is incorrect: energy transfer efficiency in aquatic ecosystems is still approximately 10% (Lindeman's 10% law), not >50%.
- (D) is incorrect: zooplankton are heterotrophs and cannot obtain energy directly from sunlight.
Q9MCQ1 mark

A scientist monitors two freshwater lake ecosystems — Lake A (a shallow, warm, nutrient-rich lake) and Lake B (a deep, cold, nutrient-poor lake). She measures the Gross Primary Productivity (GPP), plant respiration (R), and Net Primary Productivity (NPP) in both lakes. Her data shows that Lake A has a GPP of 800 g C m⁻² yr⁻¹ and R of 600 g C m⁻² yr⁻¹, while Lake B has a GPP of 200 g C m⁻² yr⁻¹ and R of 80 g C m⁻² yr⁻¹. Which of the following conclusions is CORRECT regarding the organic matter actually available to primary consumers (herbivores) in these two lakes?

Show answer
Correct Answer: (C) Lake A provides more organic matter to primary consumers because its NPP (200 g C m⁻² yr⁻¹) is higher than Lake B's NPP (120 g C m⁻² yr⁻¹).

Reasoning (for examiner reference):
• NPP (Net Primary Productivity) = GPP − R (plant respiration)
• NPP represents the organic matter actually available to consumers — it is NOT GPP.
• Lake A: NPP = 800 − 600 = 200 g C m⁻² yr⁻¹
• Lake B: NPP = 200 − 80 = 120 g C m⁻² yr⁻¹
• Therefore, despite Lake A's high respiratory cost, its NPP is still greater than Lake B's, making more organic matter available to primary consumers in Lake A.

Why distractors are wrong:
• Option (A) is incorrect — GPP alone does not determine availability to consumers; respiratory loss must be subtracted.
• Option (B) is incorrect — the NPP values are incorrectly assigned (Lake B's NPP is 120, not the higher value).
• Option (D) is incorrect — the difference is significant (200 vs 120 g C m⁻² yr⁻¹) and ecologically meaningful.
Q10Short Answer2 marks

Distinguish between Gross Primary Productivity (GPP) and Net Primary Productivity (NPP). Write the relationship between the two.

Show answer
GPP (Gross Primary Productivity): The total amount of organic matter (energy) fixed by producers (plants) through photosynthesis per unit area per unit time. It includes the organic matter used by the plant itself in respiration. [½ mark]

NPP (Net Primary Productivity): The amount of organic matter remaining after the plant has used some for its own respiration; this is the organic matter available to consumers (herbivores) at the next trophic level. [½ mark]

Relationship:
NPP = GPP − R
where R = energy lost by plant through respiration. [1 mark]

[Award full 2 marks for: correct definition of both terms with the key distinction that GPP includes respiration losses while NPP excludes them, AND the correct equation.]
Q11Short Answer2 marks

Distinguish between Gross Primary Productivity (GPP) and Net Primary Productivity (NPP) of an ecosystem. Write the relationship between them.

Show answer
GPP (Gross Primary Productivity): The total rate of organic matter (biomass) produced by producers through photosynthesis per unit area per unit time. It includes the organic matter used by plants in their own respiration.

NPP (Net Primary Productivity): The rate of organic matter available to consumers (herbivores and decomposers) after deducting the losses due to plant respiration (R) from GPP.

Relationship:
NPP = GPP − R (Respiration losses of the plant)

[Award 1 mark for correct definition/description of GPP and NPP; 1 mark for the correct relationship/formula]
Q12Short Answer2 marks

A freshwater lake receives heavy organic effluent from a nearby factory. A researcher measures the BOD of the lake water and finds it to be 380 mg/L. She also observes that fish populations have drastically declined, while microbial populations have exploded.
(i) Based on the BOD value, what conclusion can the researcher draw about the water quality of the lake?
(ii) Explain the cause of fish decline using the concept of energy/oxygen dynamics in this ecosystem.

Show answer
(i) BOD (Biological Oxygen Demand) of 380 mg/L indicates severely polluted water (clean water has BOD < 1 mg/L; sewage has BOD = 200–400 mg/L). The lake water is heavily loaded with organic matter, classifying it as highly polluted / not fit for aquatic life. [1 mark]

(ii) The large influx of organic effluent causes an explosive growth of decomposer microbes that aerobically decompose the organic matter. These microbes consume dissolved oxygen (DO) rapidly, drastically lowering the DO levels in the lake water. Fish, being aerobic organisms, cannot survive in oxygen-depleted water (hypoxic/anoxic conditions), leading to mass mortality — a phenomenon called 'cultural eutrophication' or oxygen sag. [1 mark]
Q13Short Answer2 marks

A farmer notices that his wheat field produces a large amount of biomass each year, but the amount of organic matter actually stored in the crop (available for harvest) is always less than the total biomass synthesised. Using the concepts of Gross Primary Productivity (GPP) and Net Primary Productivity (NPP), explain why the stored organic matter is always less than the total biomass synthesised.

Show answer
GPP (Gross Primary Productivity) = the total amount of organic matter (biomass) synthesised by the wheat plants per unit area per unit time through photosynthesis. (½ mark)

The wheat plants use a significant portion of this synthesised organic matter for their own cellular respiration (R) to meet their energy demands for growth, maintenance, and reproduction. (½ mark)

NPP (Net Primary Productivity) = GPP − R (plant respiration)
NPP represents the organic matter actually stored / available for the next trophic level (harvest). (½ mark)

Since R is always a positive value, NPP is always less than GPP — hence the stored/harvestable organic matter is always less than the total biomass synthesised. (½ mark)

[Award full 2 marks if both GPP and NPP are correctly defined AND the relationship GPP − R = NPP is explicitly used to explain the observation.]
Q14Short Answer3 marks

A researcher studying two aquatic ecosystems — a shallow coastal pond and a deep tropical lake — collected the following data:

| Ecosystem | GPP (kJ m⁻² yr⁻¹) | Plant Respiration (kJ m⁻² yr⁻¹) | Phytoplankton Biomass (g m⁻²) | Zooplankton Biomass (g m⁻²) |
|---|---|---|---|---|
| Coastal Pond | 8,000 | 2,000 | 4 | 12 |
| Deep Tropical Lake | 12,000 | 3,500 | 6 | 3 |

(a) Calculate the NPP for EACH ecosystem. (1 mark)
(b) The pyramid of biomass for the Coastal Pond appears inverted. Using the data provided, justify this observation with a biological explanation. (1 mark)
(c) Despite having higher NPP, the Deep Tropical Lake supports fewer trophic levels efficiently. Suggest ONE reason for this based on energy flow principles. (1 mark)

Show answer
MARKING SCHEME (3 marks total — 1 mark each for parts a, b, c)

─────────────────────────────────────────
(a) Calculation of NPP for each ecosystem: [1 mark]
─────────────────────────────────────────
Formula (state before use):
NPP = GPP − R (plant/autotroph respiration)

• Coastal Pond: NPP = 8,000 − 2,000 = 6,000 kJ m⁻² yr⁻¹
• Deep Tropical Lake: NPP = 12,000 − 3,500 = 8,500 kJ m⁻² yr⁻¹

[Award 1 mark only if BOTH values are correctly calculated with the formula stated or implied; award ½ + ½ if both values shown without formula.]

─────────────────────────────────────────
(b) Justification of inverted biomass pyramid in Coastal Pond: [1 mark]
─────────────────────────────────────────
From the data: Phytoplankton biomass (producers) = 4 g m⁻² is LESS THAN Zooplankton biomass (primary consumers) = 12 g m⁻².
This gives an INVERTED pyramid of biomass.

Biological explanation:
Phytoplankton (producers) have an extremely high turnover rate / reproductive rate — they are consumed almost as fast as they are produced. At any given instant the standing crop (biomass) measured is low, but over time they support a much larger consumer biomass. This is characteristic of aquatic/open-water ecosystems where producer biomass is small but productive.

[Award 1 mark for: identifying that producer biomass < consumer biomass from data AND stating rapid turnover/high reproductive rate of phytoplankton as the reason. Partial credit: ½ mark for stating inverted pyramid without biological reason.]

─────────────────────────────────────────
(c) Reason why higher NPP does not mean more efficient trophic support: [1 mark]
─────────────────────────────────────────
According to the 10% Law (Lindeman's Law of Energy Transfer), only about 10% of energy is transferred from one trophic level to the next; the remaining ~90% is lost as heat (respiration), excretion, and non-utilised matter.

In the Deep Tropical Lake, although absolute NPP is higher (8,500 kJ m⁻² yr⁻¹), the energy available to successive trophic levels reduces by 90% at each step. A higher GPP is accompanied by higher plant respiration (3,500 vs 2,000 kJ m⁻² yr⁻¹) — a larger proportion of gross production is used up in autotroph respiration, leaving relatively less net energy for efficient transfer up the food chain.

Alternate acceptable answer: Longer food chains result in greater cumulative energy loss — with each additional trophic level, the energy available diminishes geometrically, so supporting many trophic levels efficiently is limited regardless of total NPP.

[Award 1 mark for any ONE valid point clearly linked to the 10% law / energy loss at each trophic level / high respiration cost reducing transfer efficiency.]

─────────────────────────────────────────
VALUE POINTS SUMMARY:
• NPP formula stated + both values correct → 1
• Inverted pyramid justified with data + rapid phytoplankton turnover → 1
• 10% law / energy loss principle correctly applied to the scenario → 1
TOTAL: 3 marks
Q15Short Answer3 marks

Distinguish between Gross Primary Productivity (GPP) and Net Primary Productivity (NPP). Write the relationship between them. How does standing crop differ from productivity?

Show answer
GPP vs NPP — Distinction:

| Feature | Gross Primary Productivity (GPP) | Net Primary Productivity (NPP) |
|---|---|---|
| Definition | Total amount of organic matter / energy fixed by producers (plants) through photosynthesis per unit time per unit area | Organic matter / energy available to consumers after deducting plant's own respiratory losses |
| Also called | Total photosynthesis / Total production | Apparent photosynthesis / Net assimilation |
| Magnitude | Always greater | Always less than GPP |

*(1 mark — any two correct points of distinction)*

Relationship between GPP and NPP:

NPP = GPP − R

where R = Respiration losses of the plant (autotroph)

*(1 mark — correct formula with meaning of R)*

Standing Crop vs Productivity:

- Standing crop is the total amount of living organic matter (biomass) present in an ecosystem at a given point in time — it is a static measure (measured in g m⁻² or J m⁻²).
- Productivity (NPP) is the rate of production of new organic matter per unit time — it is a dynamic measure (measured in g m⁻² yr⁻¹ or kcal m⁻² yr⁻¹).
- Standing crop represents accumulated biomass; productivity represents the rate of addition to that biomass.

*(1 mark — correct distinction with reference to static vs rate/dynamic)*
Q16Short Answer3 marks

A forest ecologist collected leaf litter from two adjacent plots — Plot X (dominated by teak trees) and Plot Y (dominated by bamboo). After 6 months, she found that litter from Plot Y had decomposed far more completely than litter from Plot X. She also measured the mineral ion concentration in the soil of both plots and found Plot Y soil was significantly richer in inorganic nutrients.

(i) Identify the process responsible for the release of inorganic nutrients observed in Plot Y soil. Define it. (1 mark)
(ii) Suggest ONE reason, at the molecular/chemical level, why litter from Plot X (teak) decomposed more slowly than Plot Y (bamboo). (1 mark)
(iii) Name the organisms primarily responsible for decomposition and state ONE abiotic factor that would have accelerated the process in Plot Y. (1 mark)

Show answer
(i) The process is MINERALISATION.
Definition: Mineralisation is the process by which microorganisms (bacteria and fungi) break down humus further to release inorganic nutrients (mineral ions such as NO₃⁻, PO₄³⁻, SO₄²⁻, Ca²⁺, etc.) into the soil, making them available for plant uptake.
(Award 1 mark: ½ for correct name + ½ for correct definition)

(ii) Teak leaf litter is rich in LIGNIN (and/or cutin/recalcitrant compounds), which are chemically resistant, complex organic polymers that are highly resistant to microbial enzymatic degradation.
→ The presence of high lignin/cutin content in the detritus slows the rate of decomposition.
(Award 1 mark for identifying lignin/cutin/recalcitrant chemical composition as the molecular reason)

(iii) Organisms primarily responsible for decomposition: Bacteria and Fungi (decomposers / detritivores break detritus into smaller particles — any one acceptable).
Abiotic factor that accelerates decomposition: Warm temperature (optimum ~25–30°C) OR adequate soil moisture/water.
(Award 1 mark: ½ for correct organism + ½ for correct abiotic factor)

NOTE TO EXAMINER: Accept 'detrivores/detritivores' alongside decomposers for organisms. Accept either temperature or moisture as the abiotic factor. Do NOT award marks if student writes 'sunlight' as the accelerating factor — decomposition is primarily a soil/microbial process driven by temperature and moisture, not direct light.
Q17Short Answer3 marks

Define Gross Primary Productivity (GPP) and Net Primary Productivity (NPP). Write the relationship between them. Why is NPP considered more important ecologically than GPP?

Show answer
1. Gross Primary Productivity (GPP):
• GPP is the rate of production of organic matter (total amount of CO₂ fixed) by producers (green plants) per unit area per unit time through photosynthesis.
• It includes ALL the energy fixed, whether used in respiration or stored.

2. Net Primary Productivity (NPP):
• NPP is the organic matter remaining after the producers have used some energy in their own respiration (R).
• It represents the biomass available for consumption by the next trophic level (herbivores).

3. Relationship between GPP and NPP:
NPP = GPP − R (Respiration losses by producers)

4. Ecological importance of NPP over GPP:
• NPP is the amount of organic matter actually AVAILABLE to consumers (herbivores, decomposers).
• It determines the energy available for transfer to higher trophic levels and thus supports all consumers in the ecosystem.
• GPP includes energy immediately lost to plant respiration and is therefore not available to other organisms.

[Marking breakdown: Definition of GPP — 1 mark | Definition of NPP — ½ mark | Correct relationship/formula NPP = GPP − R — ½ mark | Ecological importance of NPP — 1 mark]
Q18Short Answer3 marks

A limnologist studying a freshwater lake ecosystem collected the following data on primary productivity:

• Total CO₂ fixed by phytoplankton per day = 8,000 kg
• CO₂ released by phytoplankton in respiration per day = 3,200 kg
• CO₂ released by all other organisms (consumers + decomposers) per day = 1,800 kg

(i) Calculate the Gross Primary Productivity (GPP) and Net Primary Productivity (NPP) of this lake ecosystem. Show your working. (1½ marks)

(ii) The limnologist also noticed that the pyramid of biomass for this lake was inverted. Give ONE reason why this occurs in aquatic ecosystems, even though the pyramid of energy for the same ecosystem is always upright. (1½ marks)

Show answer
Answer:

(i) Calculation of GPP and NPP:

Definition before formula:
- GPP (Gross Primary Productivity) = total rate of CO₂ fixed (total organic matter produced) by producers per unit time per unit area.
- NPP (Net Primary Productivity) = GPP − R (respiration losses of producers) = organic matter available to consumers.

Working:

| Parameter | Value |
|---|---|
| GPP (total CO₂ fixed by phytoplankton) | 8,000 kg/day |
| Respiration by phytoplankton (R) | 3,200 kg/day |
| NPP = GPP − R | 8,000 − 3,200 = 4,800 kg/day |

∴ GPP = 8,000 kg/day and NPP = 4,800 kg/day *(½ mark each = 1 mark; ½ mark for correct formula/working)*

---

(ii) Inverted biomass pyramid in aquatic ecosystems — reason:

- In aquatic ecosystems, the producers are tiny phytoplankton with extremely rapid rates of reproduction and turnover.
- At any single point in time (snapshot), the standing crop (biomass) of phytoplankton is very small, whereas the biomass of zooplankton (primary consumers) supported by them is larger — because phytoplankton are consumed almost as fast as they are produced.
- Therefore, the biomass at the producer level appears *less* than at the consumer level → pyramid of biomass is inverted.

Why the energy pyramid remains upright:
- The energy pyramid measures the total energy flow per unit time (not standing biomass). Since energy is always lost (~90%) at each trophic level and can never be regained, energy at producers > energy at primary consumers > energy at secondary consumers — regardless of how fast phytoplankton reproduce. Hence the energy pyramid is always upright and can never be inverted. *(1½ marks)*
Q19Short Answer3 marks

Distinguish between Gross Primary Productivity (GPP) and Net Primary Productivity (NPP). If the GPP of a terrestrial ecosystem is 500 g dry matter m⁻² yr⁻¹ and the respiratory loss by producers is 175 g dry matter m⁻² yr⁻¹, calculate the NPP. Also state which of the two (GPP or NPP) is available to the primary consumers and why.

Show answer
Answer: [3 marks]

Part 1 — Distinction between GPP and NPP [1 mark]

| Feature | Gross Primary Productivity (GPP) | Net Primary Productivity (NPP) |
|---|---|---|
| Definition | Total rate of organic matter (biomass) produced per unit time per unit area by photosynthesis, including what is used in respiration | The organic matter remaining after subtracting respiratory losses by producers from GPP |
| Formula | GPP = NPP + R (respiration by producers) | NPP = GPP − R |
| Biological significance | Represents total photosynthetic production | Represents biomass actually available for transfer to higher trophic levels |

*(Award ½ mark for correct definition of GPP and ½ mark for correct definition of NPP. A correctly stated formula alone also earns the mark.)*

---

Part 2 — Calculation of NPP [1 mark]

Formula:
NPP = GPP − R

Given:
GPP = 500 g dry matter m⁻² yr⁻¹
R (respiratory loss by producers) = 175 g dry matter m⁻² yr⁻¹

Therefore:
NPP = 500 − 175 = 325 g dry matter m⁻² yr⁻¹

*(Award 1 mark for correct substitution and correct answer with units. No mark if units are absent.)*

---

Part 3 — Which value is available to primary consumers, and why [1 mark]

- NPP is available to the primary consumers (herbivores), not GPP.
- Reason: A significant portion of the organic matter fixed (GPP) is consumed by the producers themselves in cellular respiration to meet their own metabolic energy requirements. Only the remaining biomass (NPP) is stored in plant tissues and is therefore available for consumption by the next trophic level (primary consumers/herbivores).
Q20Long Answer5 marks

A group of environmental science students set up a model terrestrial ecosystem in a greenhouse. They measured the following data after one growing season:

• Total solar energy available = 10,00,000 J
• Energy fixed by producers (GPP) = 1,00,000 J
• Energy lost in plant respiration = 60,000 J
• Producers are eaten by herbivores, carnivores feed on herbivores, and top carnivores feed on carnivores.

(a) Calculate the NPP of the producers in this ecosystem. Show your working. (1 mark)
(b) Using the 10% law of energy transfer, construct a labelled pyramid of energy for this ecosystem showing all four trophic levels with their energy values. (2 marks)
(c) The students found that decomposers were thriving in the litter layer of the ecosystem. Name any two groups of organisms that act as decomposers and describe, in sequence, the steps of decomposition they carry out in this ecosystem. (2 marks)

Show answer
PART (a) — 1 mark

Formula:
NPP = GPP − R (Respiration by producers)

Calculation:
NPP = 1,00,000 J − 60,000 J
NPP = 40,000 J

[1 mark for correct formula applied with correct answer: 40,000 J]

---

PART (b) — 2 marks

10% Law (Lindeman's Law): Only 10% of energy available at one trophic level is transferred to the next trophic level.

Energy values at each trophic level (calculated from NPP = 40,000 J, which is the energy available to consumers):

• Trophic Level 1 — Producers: NPP = 40,000 J
• Trophic Level 2 — Herbivores (Primary Consumers): 10% of 40,000 = 4,000 J
• Trophic Level 3 — Carnivores (Secondary Consumers): 10% of 4,000 = 400 J
• Trophic Level 4 — Top Carnivores (Tertiary Consumers): 10% of 400 = 40 J

LABELLED PYRAMID OF ENERGY:

[ T4 — Top Carnivores: 40 J ]
[ T3 — Carnivores: 400 J ]
[ T2 — Herbivores: 4,000 J ]
[ T1 — Producers: 40,000 J ]

(Pyramid of Energy — Upright; Terrestrial Ecosystem)

Note: Each bar is labelled with the trophic level name and its energy value in Joules. The pyramid of energy is always upright.

[1 mark for correct energy values at all four trophic levels]
[1 mark for correctly drawn upright pyramid with all four trophic levels labelled with names and energy values]

---

PART (c) — 2 marks

Two groups of organisms acting as decomposers:
1. Bacteria (e.g., Pseudomonas)
2. Fungi (e.g., Aspergillus, Trichoderma)
(Actinomycetes also accepted as an alternative to either of the above)

Steps of decomposition carried out in sequence:

1. Fragmentation: Detritivores (e.g., earthworms) break down dead organic matter (detritus) into smaller particles, increasing the surface area available for microbial action.

2. Leaching: Water-soluble inorganic nutrients from the detritus percolate down into the soil and get precipitated as unavailable salts in the deeper layers.

3. Catabolism (Enzymatic degradation): Bacteria and fungi secrete extracellular enzymes that chemically break down the detritus into simpler inorganic substances.

4. Humification: The partially decomposed organic matter is converted into a dark-coloured, amorphous substance called humus, which is highly resistant to further microbial action and serves as a reservoir of nutrients.

5. Mineralisation: Humus is further degraded by microbes, releasing inorganic nutrients (such as CO₂, water, and mineral salts) into the soil, making them available for uptake by plants.

[1 mark for naming any two correct groups of decomposers]
[1 mark for describing the steps of decomposition in correct sequence — any three or more steps correctly described in order are acceptable for this mark]
Q21Long Answer5 marks

Describe the flow of energy in an ecosystem. Explain the significance of the 10% law with the help of a calculated example. Also give two limitations of ecological pyramids. [5]

Show answer
ENERGY FLOW IN AN ECOSYSTEM AND 10% LAW

━━━━━━━━━━━━━━━━━━━━━━━━━━━━━━━━━━━━━━
PART A — FLOW OF ENERGY IN AN ECOSYSTEM (2 marks)
━━━━━━━━━━━━━━━━━━━━━━━━━━━━━━━━━━━━━━

Value Point 1 [1 mark]:
Energy flows UNIDIRECTIONALLY from the Sun through successive trophic levels and is NEVER recycled back (unlike matter/nutrients). The flow is always from a lower trophic level to a higher trophic level and cannot be reversed.

Value Point 2 [1 mark]:
Producers (T1) fix solar energy through photosynthesis → energy passes to Primary consumers/Herbivores (T2) → Secondary consumers (T3) → Tertiary consumers/Top carnivores (T4). At each trophic level, a large fraction of energy (~90%) is lost as heat through respiration, incomplete digestion, and non-assimilated fractions; only a small fraction is available for transfer to the next trophic level.

━━━━━━━━━━━━━━━━━━━━━━━━━━━━━━━━━━━━━━
PART B — 10% LAW WITH CALCULATED EXAMPLE (2 marks)
━━━━━━━━━━━━━━━━━━━━━━━━━━━━━━━━━━━━━━

Value Point 3 — Statement of 10% Law [1 mark]:
According to Lindeman's 10% Law (1942), only 10% of the energy available at one trophic level is transferred to the next trophic level; the remaining ~90% is lost as heat during respiration and other metabolic activities. This law explains why food chains are generally limited to 3–4 trophic levels, as the energy available becomes too small to sustain a population beyond T4, and why a vegetarian diet is energetically more efficient than a non-vegetarian diet.

Value Point 4 — Calculated Example [1 mark]:
Suppose producers (T1) fix 1,00,000 J of energy:

T1 (Producers) → 1,00,000 J
T2 (Primary consumers) → 10,000 J (10% of T1)
T3 (Secondary consumers) → 1,000 J (10% of T2)
T4 (Tertiary consumers) → 100 J (10% of T3)

At each step, 90% of energy is lost (used in respiration, lost as heat, excreted as faeces, etc.), and only 10% is passed on to the next trophic level.

━━━━━━━━━━━━━━━━━━━━━━━━━━━━━━━━━━━━━━
PART C — TWO LIMITATIONS OF ECOLOGICAL PYRAMIDS (1 mark + 1 mark = 2 marks)
━━━━━━━━━━━━━━━━━━━━━━━━━━━━━━━━━━━━━━

Limitation 1 [1 mark]:
Ecological pyramids do not accommodate organisms that occupy more than one trophic level simultaneously (e.g., omnivores such as humans, who feed at both T2 and T3), making it difficult to assign them to a single fixed trophic level.

Limitation 2 [1 mark]:
Saprophytes (decomposers/detritivores) are not given any place or position in ecological pyramids, even though they play a crucial role in the decomposition of organic matter and energy flow within the ecosystem.

━━━━━━━━━━━━━━━━━━━━━━━━━━━━━━━━━━━━━━
MARK SUMMARY
━━━━━━━━━━━━━━━━━━━━━━━━━━━━━━━━━━━━━━
Part A (Energy flow): 1 + 1 = 2 marks
Part B (10% Law statement + Calculated example): 1 + 1 = 2 marks
Part C (Limitation 1 + Limitation 2): 1 + 1 = 2 marks
[Any 5 value points out of the above = 5 marks total]
Q22Long Answer5 marks

A forest ecosystem was studied over two consecutive years. In Year 1, the ecosystem received 1,00,000 J of solar energy. The gross primary productivity (GPP) recorded was 10,000 J/m²/year, and the plants used 3,000 J/m²/year in respiration. A student calculated the energy available at each subsequent trophic level and also noted that a large quantity of leaf litter, dead wood, and animal dung accumulated on the forest floor.

(i) Define GPP and NPP. Calculate the NPP for this ecosystem. [1½ marks]
(ii) The student observed that only about 10 J/m²/year of energy was available to the tertiary consumers. Using the 10% law of energy transfer, construct a labelled energy flow diagram (pyramid) showing the energy values at all four trophic levels (Producers → Primary Consumers → Secondary Consumers → Tertiary Consumers). [2 marks]
(iii) Name the process by which the accumulated leaf litter and dead organic matter is broken down on the forest floor. Name any TWO organisms responsible for this process and state ONE condition that would slow it down significantly. [1½ marks]

Show answer
MARKING SCHEME — Total: 5 marks

─────────────────────────────────────
PART (i): GPP, NPP and Calculation [1½ marks]
─────────────────────────────────────
• GPP (Gross Primary Productivity): The total rate of organic matter (biomass) produced by producers per unit area per unit time through photosynthesis; also expressed as the total CO₂ fixed per unit area per unit time. [½ mark]

• NPP (Net Primary Productivity): The organic matter remaining after subtracting the energy used by plants in their own respiration from GPP. It is the organic matter available to consumers.
Formula: NPP = GPP − R (Respiration by producers) [½ mark]

• Calculation:
NPP = 10,000 − 3,000 = 7,000 J/m²/year [½ mark]

─────────────────────────────────────
PART (ii): Energy Flow Diagram [2 marks]
─────────────────────────────────────
Working backward using Lindeman's 10% Law:
Tertiary Consumers = 10 J/m²/year (given)
Secondary Consumers = 10 × 10 = 100 J/m²/year
Primary Consumers = 100 × 10 = 1,000 J/m²/year
Producers (NPP available) = 1,000 × 10 = 10,000 J/m²/year

Labelled Upright Pyramid of Energy:

┌─────────────────────────────────────────┐
│ ENERGY FLOW DIAGRAM │
│ (Ecological Energy Pyramid) │
├─────────────────────────────────────────┤
│ │
│ Tertiary Consumers ████ 10 J/m²/yr │
│ │
│ Secondary Consumers ████████ │
│ 100 J/m²/yr │
│ │
│ Primary Consumers ████████████████ │
│ 1,000 J/m²/yr │
│ │
│ Producers ████████████████████ │
│ (base) 10,000 J/m²/yr │
│ │
│ ← Energy lost as heat at each level → │
└─────────────────────────────────────────┘

[Diagram correct with all 4 trophic levels labelled with energy values — 1 mark]
[10% law correctly applied — all four values correct — 1 mark]

Note: Only ~10% of energy at each trophic level is transferred to the next level. The remaining ~90% is lost as heat during respiration, as undigested matter in faeces, and in metabolic activities.

─────────────────────────────────────
PART (iii): Decomposition [1½ marks]
─────────────────────────────────────
• The process is called DECOMPOSITION (also accept: saprotrophic nutrition / mineralisation). [½ mark]

• The dead organic matter acted upon is called DETRITUS. Decomposition converts complex organic compounds into inorganic substances (CO₂, water, mineral salts) — this is also called MINERALISATION.

• TWO organisms (decomposers/detritivores) responsible:
(Any two of the following for ½ mark each — max 1 mark)
1. Fungi — e.g., Trichoderma sp. / Aspergillus sp. (break down cellulose and lignin)
2. Bacteria — e.g., Bacillus sp. / Pseudomonas sp. (secrete extracellular enzymes)
3. Earthworms (detritivores — fragment dead organic matter physically, increasing surface area)
[½ + ½ = 1 mark for any two correct organisms]

• ONE condition that would SLOW decomposition significantly:
(Any one of the following for ½ mark)
— Low temperature (reduces enzyme activity of decomposers)
— Anaerobic conditions / waterlogged / absence of O₂ (most decomposers are aerobic)
— Low moisture / extreme drought (decomposers require water for metabolic activity)
— Very high acidity / low pH (inhibits microbial enzyme activity)
[½ mark]

─────────────────────────────────────
VALUE POINTS SUMMARY:
─────────────────────────────────────
(i) GPP definition — ½m | NPP definition — ½m | Calculation: NPP = 7,000 J/m²/year — ½m
(ii) Diagram with all 4 levels labelled — 1m | Correct energy values using 10% law — 1m
(iii) Name of process (decomposition) — ½m | Any two decomposer organisms — 1m | Any one slowing condition — ½m

TOTAL = 5 marks
Q23Long Answer5 marks

A school ecology club visited two sites near their village: Site A was a freshwater pond with abundant sunlight, rich in aquatic plants and algae; Site B was a dense, shaded forest floor covered with fallen leaves and decomposing matter. They collected data and drew an ecological pyramid for each site.

(a) The students found that the pyramid of biomass at Site B (forest) was upright, while at a nearby marine site (Site C) the pyramid of biomass was inverted. Explain why the pyramid of biomass is inverted in a marine/aquatic ecosystem.

(b) Draw a well-labelled diagram of an upright pyramid of energy for a grassland ecosystem showing at least THREE trophic levels. Mention the unit used to express energy at each trophic level.

(c) The students measured the following values for Site A (the pond):
• Gross Primary Productivity (GPP) = 500 g dry matter m⁻² yr⁻¹
• Respiration by producers (R) = 100 g dry matter m⁻² yr⁻¹

(i) Calculate the Net Primary Productivity (NPP) of Site A.
(ii) State which value — GPP or NPP — represents the organic matter actually available to the primary consumers, and why.

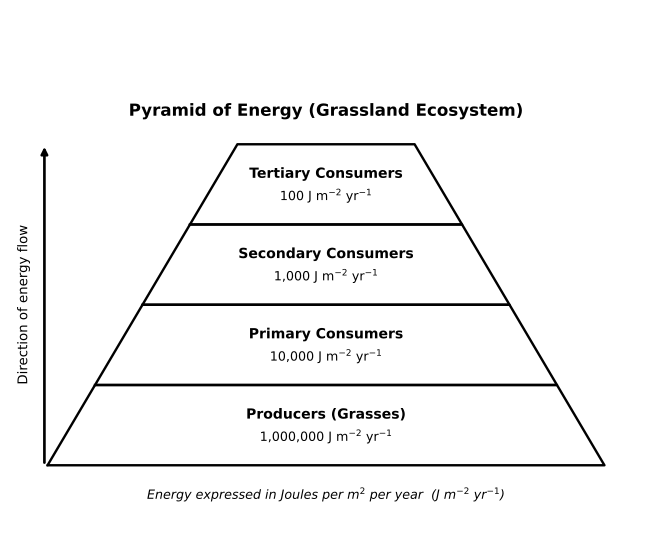
Diagram for question 23: Ecosystem
Show answer
CBSE MARKING SCHEME — 5 Marks

(a) Inverted Pyramid of Biomass in Aquatic Ecosystems [1 + 1 = 2 marks]

Value Point 1 (1 mark):
In marine/aquatic ecosystems, the producers are tiny phytoplankton (microscopic algae) that have a very small standing biomass at any given time, while the consumers (zooplankton, fish) that depend on them have a much larger total biomass.

Value Point 2 (1 mark):
This is because phytoplankton reproduce and are consumed extremely rapidly (high turnover rate). At any single moment the biomass of producers is less than that of consumers, making the pyramid appear inverted — even though the total energy fixed over time is large.

──────────────────────────────────────
(b) Labelled Diagram — Upright Pyramid of Energy for a Grassland Ecosystem [2 marks]

[Award 1 mark for correct upright pyramid shape with trophic levels correctly ordered; award 1 mark for correct labels including unit]

DIAGRAM (to be drawn in answer book):

```
┌──────────────────────────────────────────────┐
│ PYRAMID OF ENERGY — GRASSLAND ECOSYSTEM │
│ (Unit: kcal m⁻² yr⁻¹ OR J m⁻² yr⁻¹) │
└──────────────────────────────────────────────┘


Tertiary Consumers ▲
(Snakes / Hawks) ███ ← Smallest bar (least energy)

Secondary Consumers ████████
(Frogs / Toads)

Primary Consumers ████████████████
(Grasshoppers)

Producers ████████████████████████ ← Largest bar (most energy)
(Grasses)

─────────────────────────────────────────────────────────→
Energy (kcal m⁻² yr⁻¹)
```

Labels required on diagram:
• Each trophic level named (Producers / Primary Consumers / Secondary Consumers / Tertiary Consumers)
• Bars decrease in size from bottom (producers) to top (tertiary consumers)
• Unit stated: kcal m⁻² yr⁻¹ (or J m⁻² yr⁻¹)
• Title: Pyramid of Energy

Key point to note: The pyramid of energy is ALWAYS upright in every ecosystem (unlike pyramids of biomass or number which can be inverted). This is because energy is lost at each trophic level (~90% lost as heat during respiration; only ~10% transferred to the next level — Ten Percent Law, Lindeman, 1942).

──────────────────────────────────────
(c) Calculation and Explanation [1 mark]

(i) Calculation of NPP: [½ mark for correct formula + ½ mark for correct answer = 1 mark]

Formula:
NPP = GPP − R

Substituting given values:
NPP = 500 − 100
NPP = 400 g dry matter m⁻² yr⁻¹

(ii) NPP is the value available to primary consumers. [Award as part of the 1 mark above OR as a separate value point depending on examiner discretion — accept either]

Reason: GPP is the total amount of organic matter (energy) fixed by the producers through photosynthesis. Out of this, the producers use a portion (R = 100 g) for their own cellular respiration (maintenance, growth, reproduction). Only the remaining organic matter — the NPP — is stored in plant tissues and is therefore available to the herbivores (primary consumers) for consumption.

──────────────────────────────────────
MARK ALLOCATION SUMMARY:
(a) Inverted pyramid explanation — 2 marks (1 + 1)
(b) Labelled pyramid of energy diagram — 2 marks (1 for diagram + 1 for labels/unit)
(c)(i) NPP calculation with formula — 1 mark
[Total = 5 marks]

Want unlimited practice on Ecosystem?

The full ClearSteps bank has 23+ reviewed questions on this chapter alone — with step-wise solutions, difficulty levels, and progress tracking. Verify your WhatsApp number and your free trial starts right here.

CBSE · CLASS 12
🎟️14-day free trial · code PRAC auto-applied
Mobile Number
+91
OTP will be sent to your WhatsApp

⭐ Trusted by 12,000+ students across India

Ecosystem — Class 12 Biology Practice Questions