A wildlife biologist is studying two animal populations in the Corbett National Park. She records the following data for a tiger population over two consecutive years:
• Year 1: Population size (N) = 120 tigers; Birth rate = 18 per year; Death rate = 12 per year; Immigration = 4 per year; Emigration = 6 per year.
• Year 2: The population shows a dramatic decline — rangers discover that a severe outbreak of canine distemper virus has killed many individuals. Surviving tigers are now restricted to isolated forest patches due to new highway construction cutting through a reserve. The biologist also notes that the age pyramid of the tiger population has shifted to show a very large post-reproductive class and a very small pre-reproductive class.
She compares this with a population of spotted deer (prey) in the same reserve, which is currently showing a J-shaped growth curve despite abundant resources.
Read the following passage and answer the questions that follow:
A wildlife biologist is studying two animal populations in the Corbett National Park. She records the following data for a tiger population over two consecutive years:
• Year 1: Population size (N) = 120 tigers; Birth rate = 18 per year; Death rate = 12 per year; Immigration = 4 per year; Emigration = 6 per year.
• Year 2: The population shows a dramatic decline — rangers discover that a severe outbreak of canine distemper virus has killed many individuals. Surviving tigers are now restricted to isolated forest patches due to new highway construction cutting through the reserve. The biologist also notes that the age pyramid of the tiger population has shifted to show a very large post-reproductive class and a very small pre-reproductive class.
She compares this with a population of spotted deer (prey) in the same reserve, which is currently showing a J-shaped growth curve despite abundant resources.
Show answerHide answer
Calculate the population growth rate (dN/dt) for the tiger population in Year 1.
Formula: dN/dt = (Birth rate + Immigration) − (Death rate + Emigration)
dN/dt = (18 + 4) − (12 + 6)
= 22 − 18
= +4 tigers per year ✦ 1 mark
(The population is increasing by 4 individuals per year.)
────────────────────────────────────────
Sub-part (ii): [1 mark]
What does the age pyramid described for the Year 2 tiger population indicate about the future of this population? Name this type of age pyramid.
• The pyramid type described = Declining / Regressive pyramid ✦ ½ mark
• Interpretation: A large post-reproductive class and a very small pre-reproductive class means very few individuals will be available for future reproduction. This indicates the population size will DECREASE further in coming years — the population has a poor growth prospect and faces a risk of local extinction. ✦ ½ mark
────────────────────────────────────────
Sub-part (iii): [1 mark]
The highway construction has restricted tigers to isolated forest patches. Explain ONE population-level consequence of this habitat fragmentation on the genetic health of the tiger population.
• Small, isolated populations undergo genetic drift — random changes in allele frequencies. ✦ ½ mark
• This leads to inbreeding (mating between closely related individuals) → inbreeding depression → reduced genetic diversity → lower adaptability to disease, environmental change and reduced reproductive fitness. This makes the population even more vulnerable to extinction. ✦ ½ mark
(Acceptable alternative: Founder effect — if a small group gets isolated, they carry only a fraction of the original gene pool → reduced genetic variation in the isolated sub-population.)
────────────────────────────────────────
Sub-part (iv): [1 mark]
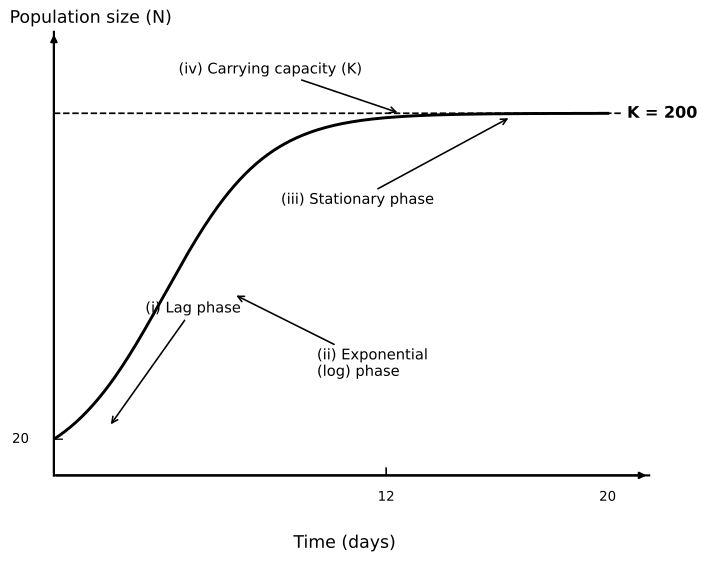
The spotted deer population is showing a J-shaped growth curve. However, a biologist argues that this cannot continue indefinitely in nature. Name the growth model that will EVENTUALLY apply to this deer population and write the equation that describes it. Identify the term in the equation that is absent in the J-shaped growth model.
• Growth model that will eventually apply = Logistic growth (S-shaped / sigmoid growth curve) ✦ ¼ mark
• Equation:
dN/dt = rN × [(K − N) / K] ✦ ½ mark
Where:
r = intrinsic rate of natural increase
N = population size at time t
K = carrying capacity (maximum population size the environment can sustain)
• The term ABSENT in J-shaped (exponential) growth model = (K − N)/K
This is the environmental resistance term (also written as the logistic term). It represents the unutilised resources / unused carrying capacity. As N approaches K, this term approaches zero, slowing growth. ✦ ¼ mark